
Volatility, Key Support Levels, and What Comes Next
Bitcoin has seen heightened volatility over the past few sessions, prompting a closer look at the short-term price action. While the larger time frame outlook was covered previously, this update focuses on the smaller time frame, where momentum and market structure are shifting rapidly.
Market Context: Broad Sell-Off Impacts Bitcoin
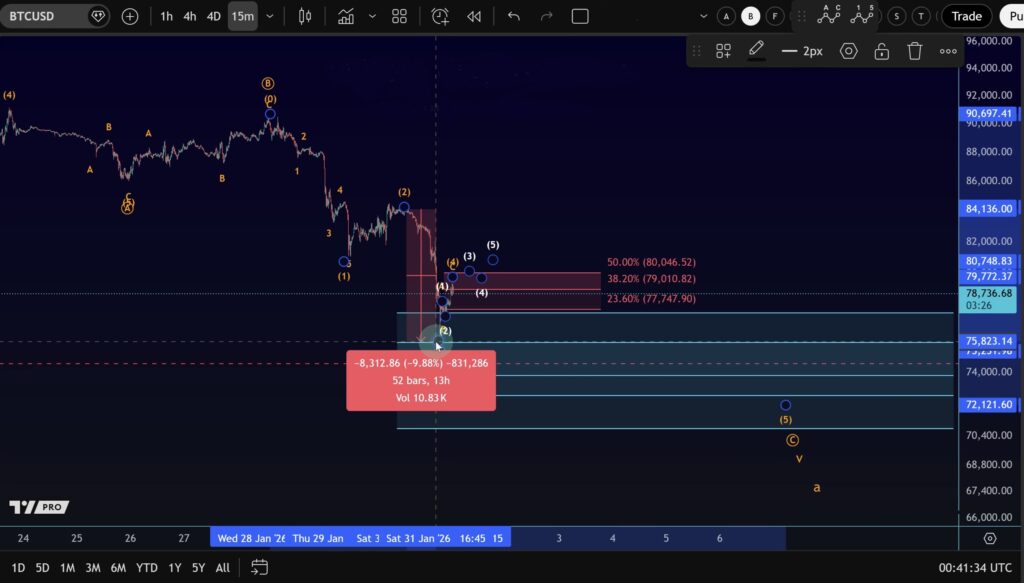
Following Friday’s local top, markets experienced a sharp sell-off. Bitcoin was not immune, posting a roughly 10% correction into Saturday. While this move is significant—especially given that Bitcoin had already corrected throughout the week—it still pales in comparison to the dramatic declines seen elsewhere.
For example, silver experienced an almost 30–40% crash, highlighting that Bitcoin’s relative strength remains intact despite the pullback.
Current Price Action and Resistance Levels
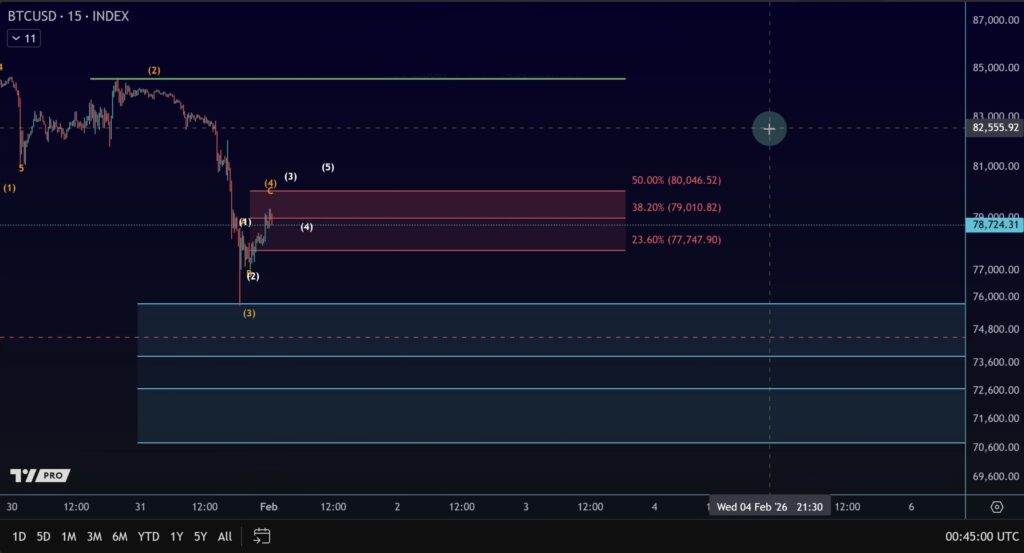
Bitcoin has now reached its first key resistance zone, located between:
$77,747
$80,046
This area represents the nearest meaningful resistance on the chart. As long as price remains below $80,046, the broader focus remains on lower prices.
At this stage, the move higher appears to be a three-wave advance, best interpreted as an ABC corrective structure, potentially part of a wave four scenario. There is currently no clear evidence that a major low is already in place.
Elliott Wave Perspective: Is the Third Wave Complete?
From a standard Elliott Wave perspective, the third wave may not yet be fully complete. Ideally, based on typical extensions, price could still push slightly lower before a more sustainable bottom forms.
That said, conditions are beginning to shift:
The daily RSI is oversold, currently below 30
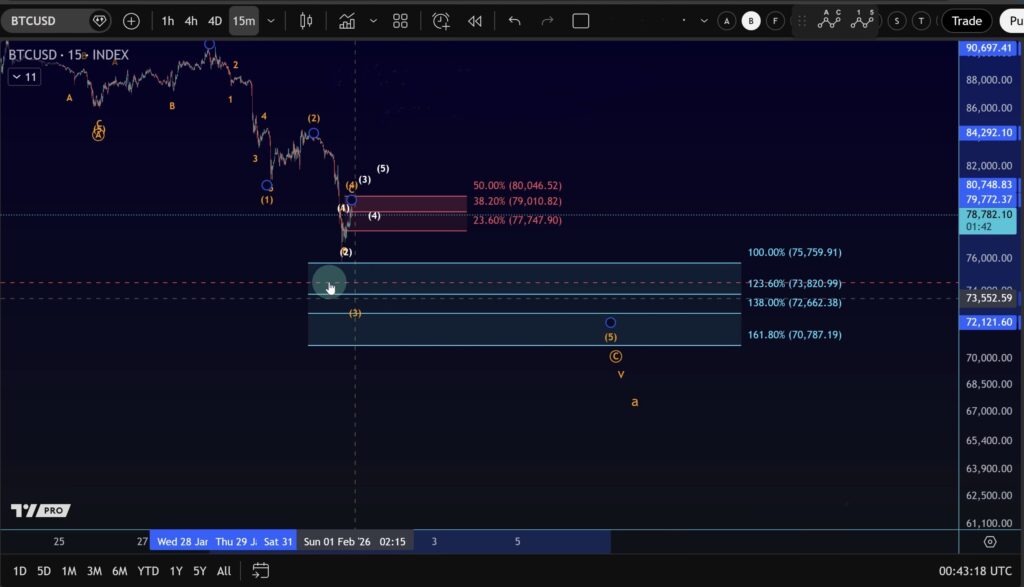
Price has reached the $74,000–$75,000 region, which was previously highlighted as an ideal target
This zone sits very close to the April low, where buyers are already starting to step in
The 100% Fibonacci extension, a key support level, has now been reached
These factors suggest that bearish momentum may start to weaken in this area.
What Would Confirm a Bitcoin Bottom?
At present, there is still no confirmation that a definitive low is in. However, several technical signals would change that outlook:
Early Indication
A five-wave impulsive move to the upside
A decisive break above $80,046
Stronger Confirmation
A break above $84,550
A completed five-wave structure—characterized by higher highs and higher lows—would strongly suggest that a meaningful bottom has formed.
Short-Term Outlook: Bounce or Trend Reversal?
Bitcoin has already bounced nearly 5% off the recent low. However, without impulsive structure, this remains just a bounce, not yet a trend reversal.
A possible scenario includes:
A liquidity sweep below the April low
Followed by a sharp recovery
Such a move could set the stage for a much larger rally later on—even potentially toward $100,000, though that remains part of the higher time frame discussion.
Altcoin Check-In: Ethereum and Market Structure
Bitcoin: The orange scenario remains the preferred path, pointing toward the $74,000 area
Ethereum: The yellow scenario continues to be the most probable and has played out almost perfectly, following the projected structure in textbook fashion
Final Thoughts
This was a short-term, intraday Bitcoin update, focused on immediate market structure rather than long-term projections. While downside risk still exists, the market is entering a zone where bear exhaustion becomes increasingly likely.
Next week could be very interesting from a technical standpoint.
For now:
Resistance remains overhead
Confirmation is still missing
But the conditions for a potential low are beginning to align
Stay patient, stay data-driven, and let the chart confirm the next move.