
Bitcoin Update – Key Takeaways
1. Trend & Structure
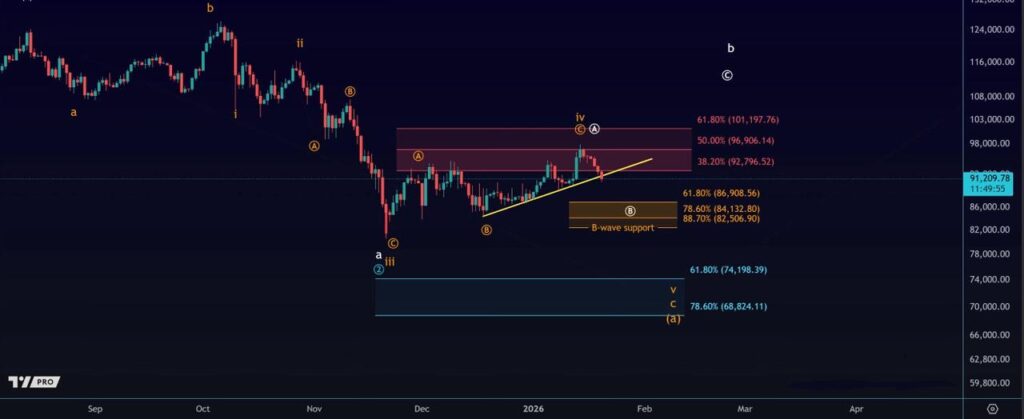
Price is below the yellow trendline → bearish pressure.
Daily candle close is important for confirmation.
Analyst believes wave 4 top is likely in.
First major bearish signal: break below Friday’s low.
 2. Main Scenario (Orange – Most Probable)
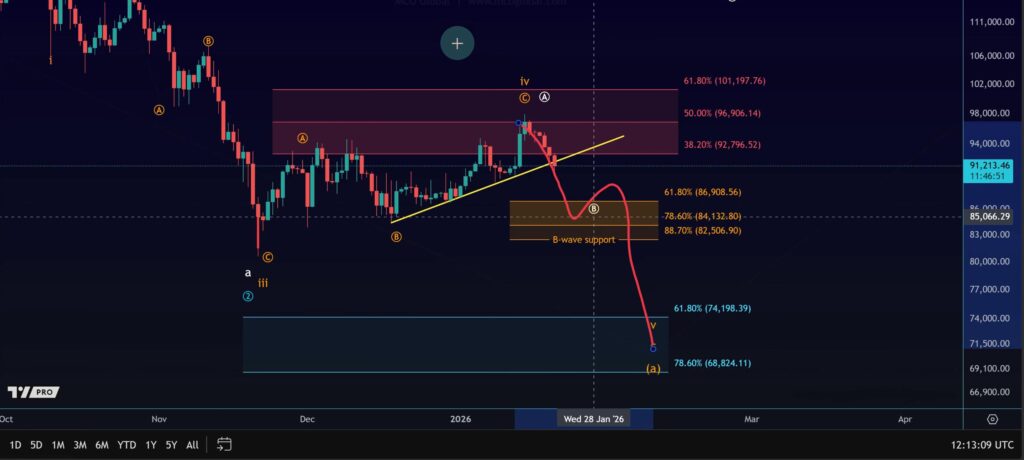
Expecting a 5-wave decline.
Next major downside target zone:
$74,000–$75,000Decline could form an ABC structure.
This would be a healthy corrective move.
3. Alternative Scenario (White – Short-Term Bullish)
A bounce is possible if bulls step in.
Support zone to watch:
$82,560 – $86,900If price reverses from this area, we may see a B-wave up.
But this would likely be corrective, not a breakout to new ATHs.
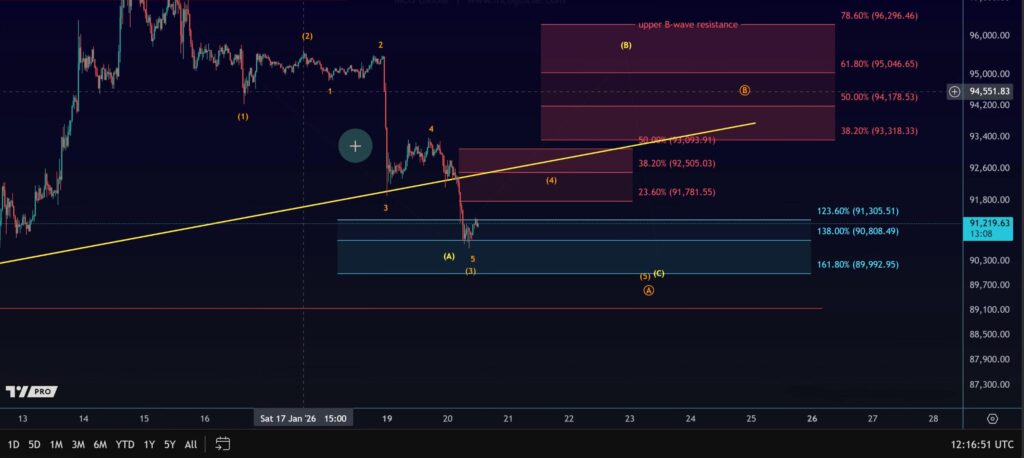
4. Short-Term Levels
Support:
$89,990
$89,420
$89,200 (structural low)
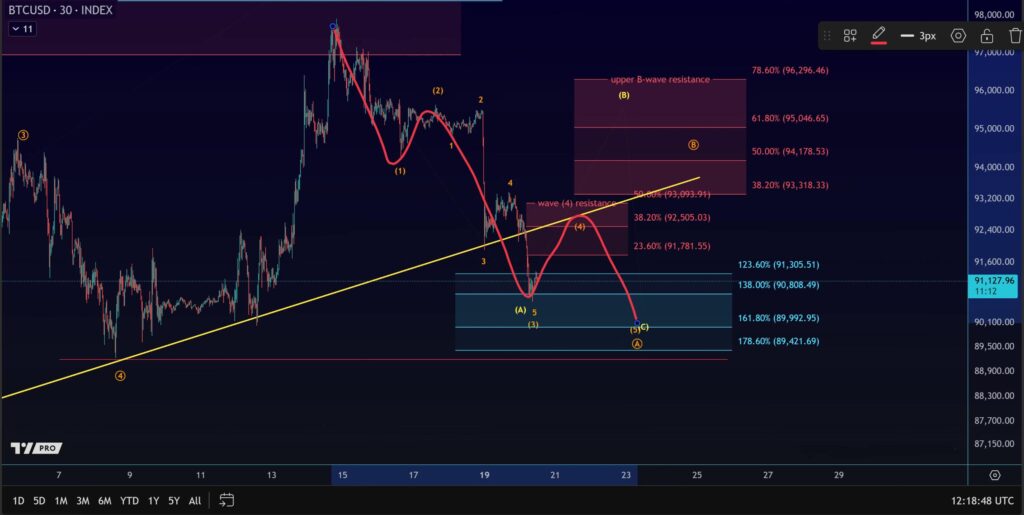
Resistance (Wave 4 bounce zone):
$91,780 – $93,900
5. What the Analyst is Watching
Wants to see a clean 5-wave decline for confirmation.
If only 3 waves complete, downside might already be done.
Next expected move: Wave 4 bounce, then potentially one more low.
Bias Summary
| Timeframe | Bias |
|---|---|
| Short-term | Bearish → bounce possible |
| Medium-term | Bearish |
| Macro | Still corrective |