
In this update, we zoom into Bitcoin’s 30-minute timeframe to analyze the evolving microstructures. While the daily chart was covered earlier, the shorter timeframe now offers valuable clues about what could come next.
So far, price action has unfolded almost exactly as expected, forming a clean five-wave decline. This is significant because once a five-wave move completes, the market typically becomes primed for a reversal—or at least a corrective bounce.
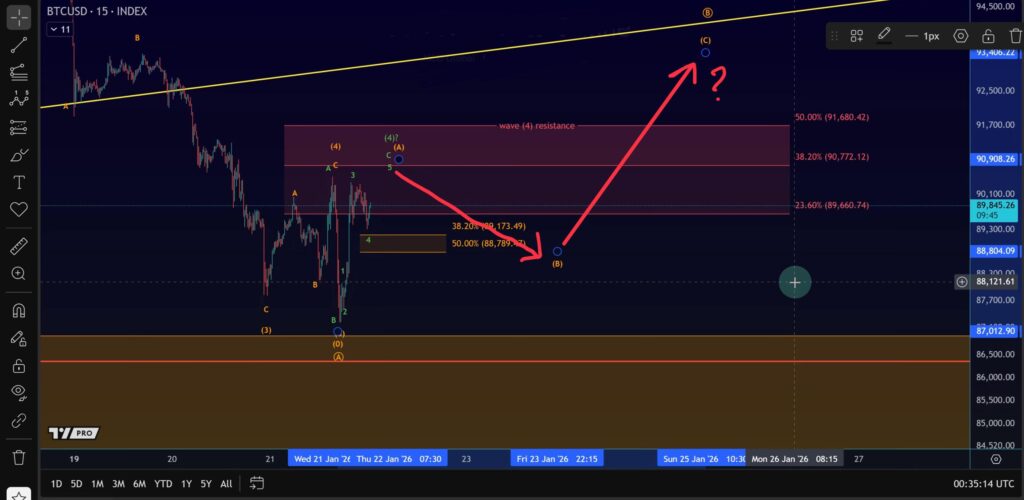
This does not necessarily mean a full bullish breakout is coming. Instead, the most likely outcome is a B-wave bounce, which could result in a retest of the yellow trendline.
Recap: Where We Are in the Larger Structure
For those new here, the broader idea remains unchanged:
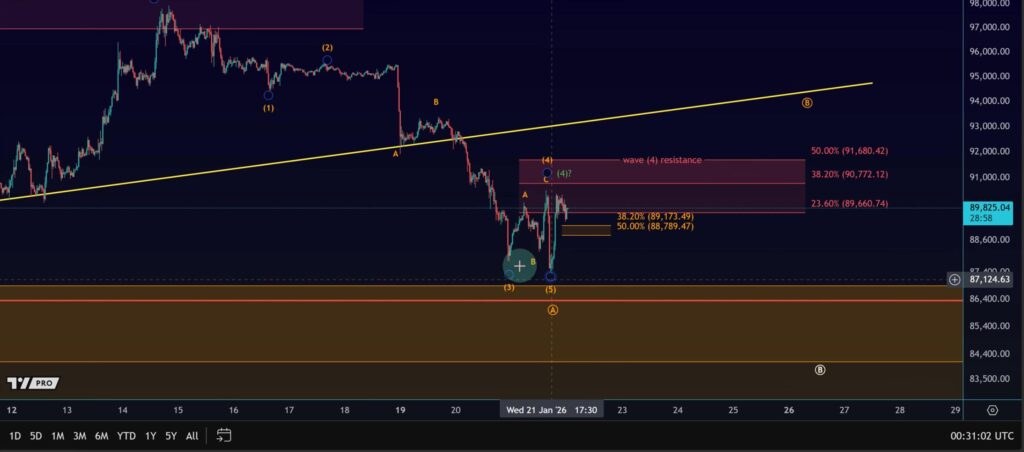
- Roman Wave 4 topped around January 14.
- We then saw a sequence of Wave 1, Wave 2, Wave 3.
- Wednesday brought a Wave 4 bounce into resistance.
- Price was rejected from resistance.
- This was followed by a Wave 5 decline, completing the five-wave structure.
Although the Wave 4 retracement was shallow and fast, price respected the internal structure perfectly.
We also saw a reaction from a micro support zone yesterday, followed by a move into resistance and a textbook rejection. Shortly after, news related to Trump’s comments on tariffs and Greenland appeared, which may have helped finalize Wave 5 by triggering a lower low.
Why a Short-Term Upside Move Is Now Possible
With the five-wave decline now complete, conditions favor at least a local upside reversal.
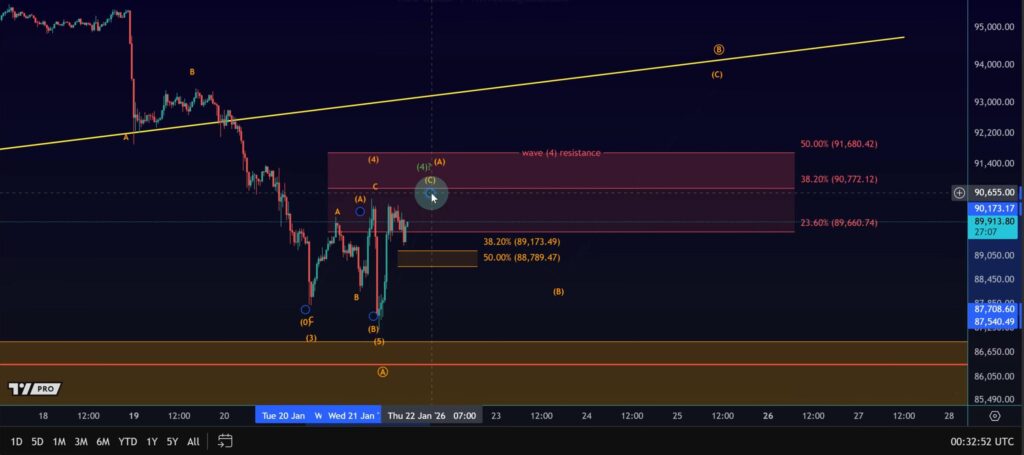
This would likely unfold as part of a larger ABC structure, where:
- Circle Wave A may already be complete
- A B-wave bounce could now be developing
- This bounce could test the yellow trendline
However, it is important to note that another low in Wave A cannot be ruled out. Markets often remain unpredictable, especially when deeply oversold.
The Two Scenarios to Watch
Scenario 1: Green Count – Wave 4 Extends
In this case:
- Wave 4 has not topped yet.
- We may see another extension upward.
- After topping, price could still make another low in Circle Wave A.
- Only then would Circle Wave B begin.
This scenario implies more upside first, followed by another drop.
Scenario 2: Orange Count – Wave A Completed
In this scenario:
- Circle Wave A has already completed.
- We are now starting Circle Wave B.
- The current rally is the beginning of that corrective move.
This scenario becomes more likely if price continues higher without breaking key micro supports.
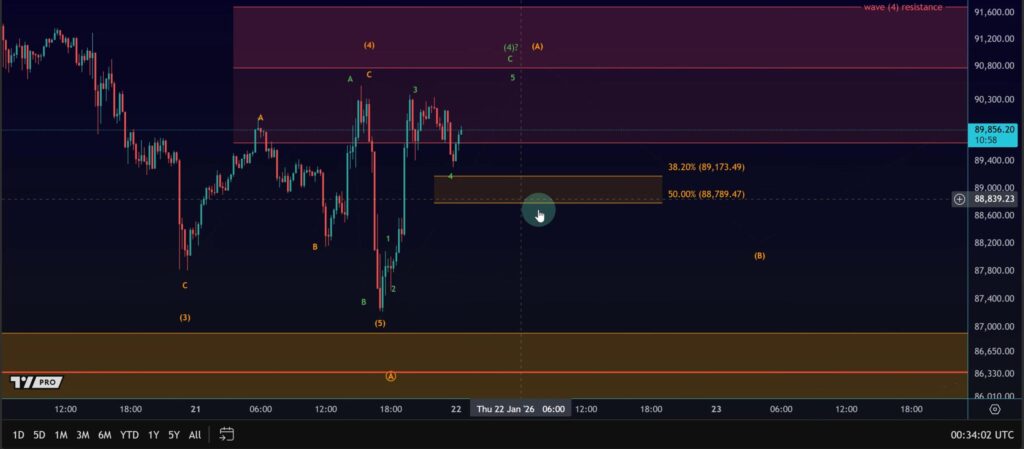
Key Micro Levels to Watch
Immediate Resistance
- $88,789
Next Resistance Zone
- $90,772 – $91,680
If price pushes into this zone, the structure of the next pullback will be critical.
What Happens After the Next High?
After the next push higher, a pullback is expected regardless of the scenario.
At that point:
- Micro support will be added for Wave B.
- If the pullback forms a three-wave structure, it would strongly support the bullish continuation case.
- A rally from that support zone would confirm that Circle Wave B is underway.
This microstructure will give us the confirmation we need.Final Thoughts
Bitcoin has completed a textbook five-wave decline on the 30-minute chart. This alone makes a short-term upside reaction highly probable.
While another low cannot be ruled out, the market has already done what it needed to do structurally. The only irregularity is that Wave 5 was slightly short—but that can be explained by the sudden news catalyst.
At this stage:
- Short-term bias: Cautiously bullish
- Medium-term: Still corrective
- Key focus: Micro pullback structure after the next high