
Bitcoin’s price action has entered a critical junction, where the market is holding above key support zones but still trading inside a larger corrective structure. While the probability of major moves over the weekend appears low—especially with the U.S. stock market closed on Monday—traders should remain alert to how Bitcoin reacts to these levels.
The Bigger Picture: Correction Still Unfolding
For several days, the outlook has been consistent:
•The correction is not yet complete.
•Bitcoin could either be in a Wave 4 pullback before a final Wave 5 rally or in a broader corrective decline that continues lower.
The difference between these two outcomes will only become clear once we see the next larger bounce. Until then, the bias remains cautious.
Key Support Levels to Watch
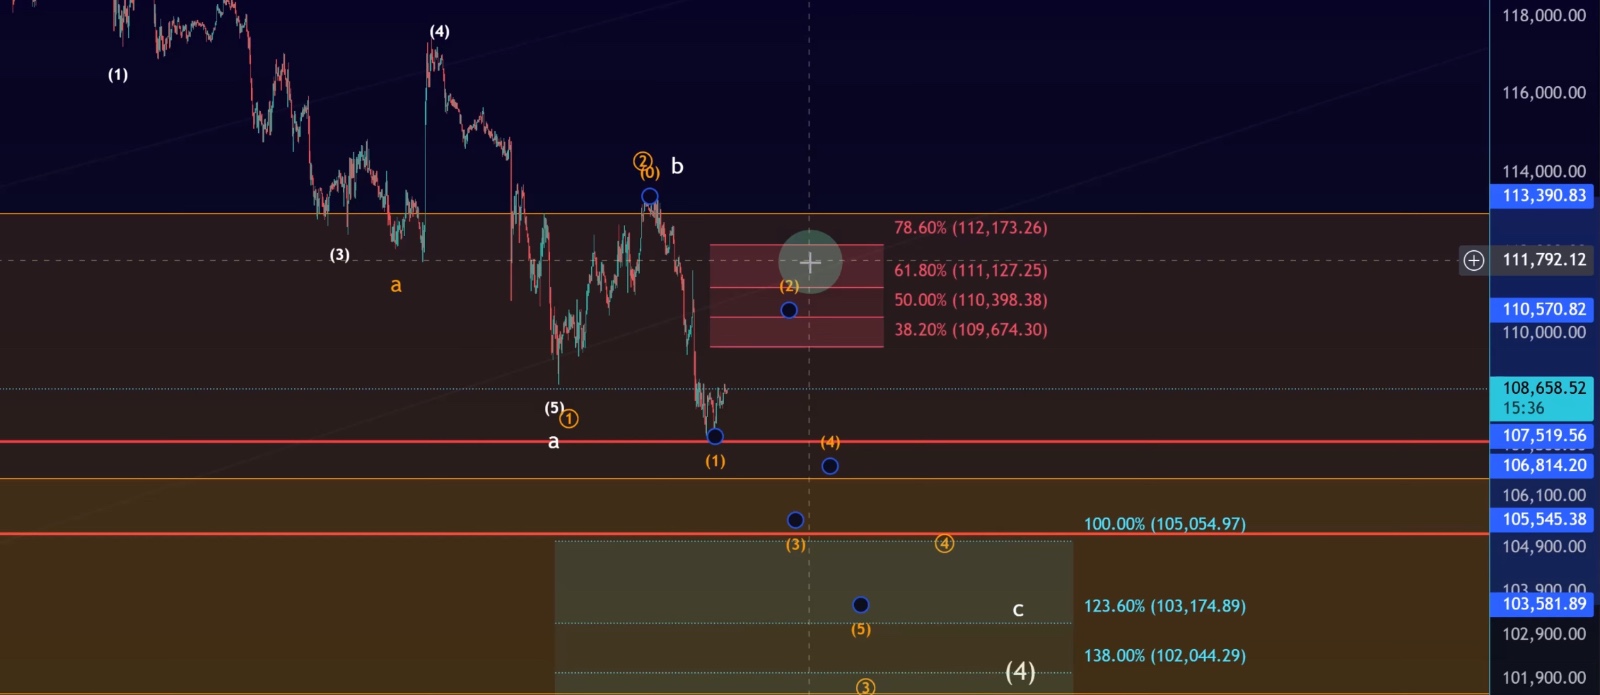
Bitcoin is currently hovering above $111,550, which is the 50% Fibonacci retracement of the third-wave rally. Holding above this level keeps the bullish perspective alive. A sustained breakdown below it, however, would weaken the case for a direct rally.
Here are the most relevant supports:
•$111,550 → 50% retracement of Wave 3 rally; critical junction.
•$109,100 → August 24–25 support, still holding.
•$107,600 – $105,230 → Previous swing low zone.
•$106,510 → 38.2% retracement, a common target in Wave 4 corrections.
•$105,300 → Structural support.
•$102,050 – $101,550 → Cluster of Fibonacci overlaps; major support of interest.
•$96,000 → VRVP volume profile support (lower probability unless weakness accelerates).
If Bitcoin falls decisively below the 78.6% retracement, it would strongly suggest that a third wave decline is already unfolding, confirming further weakness.
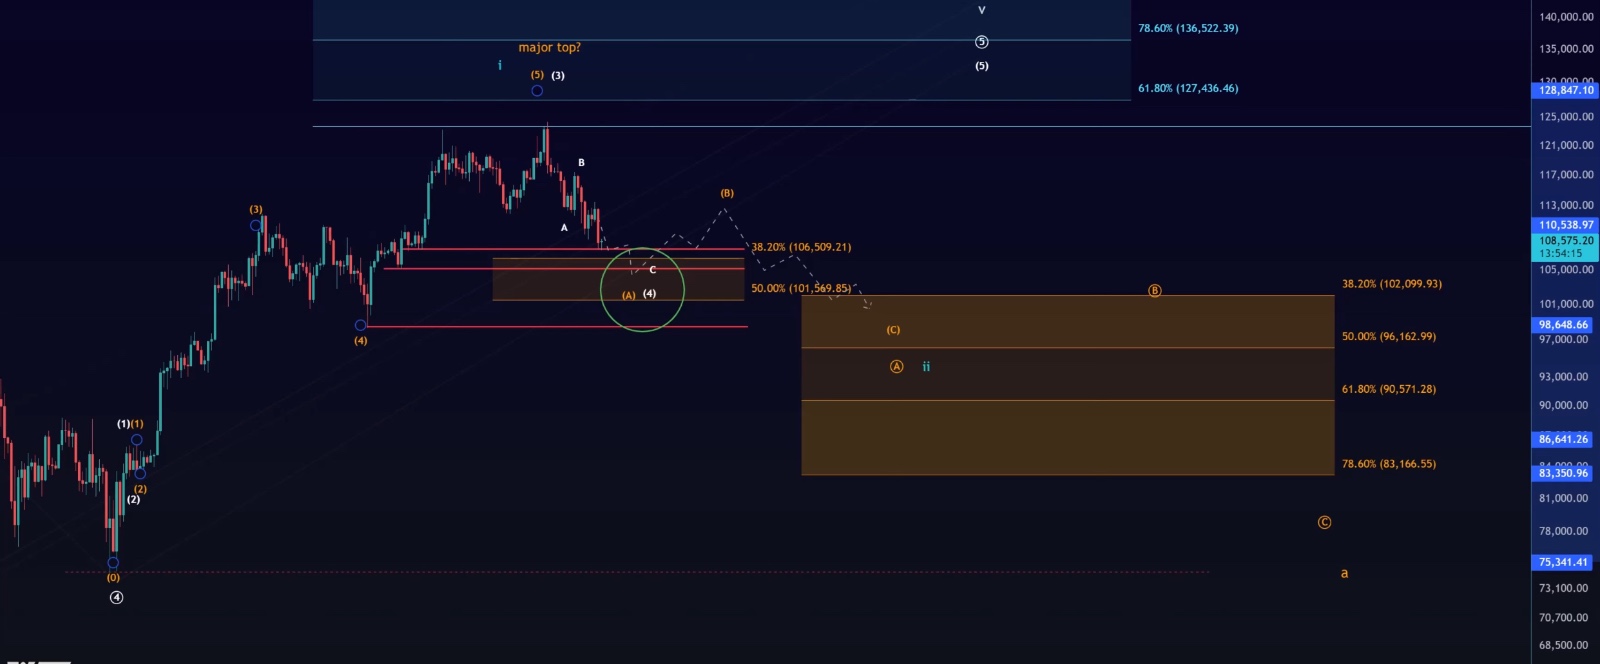
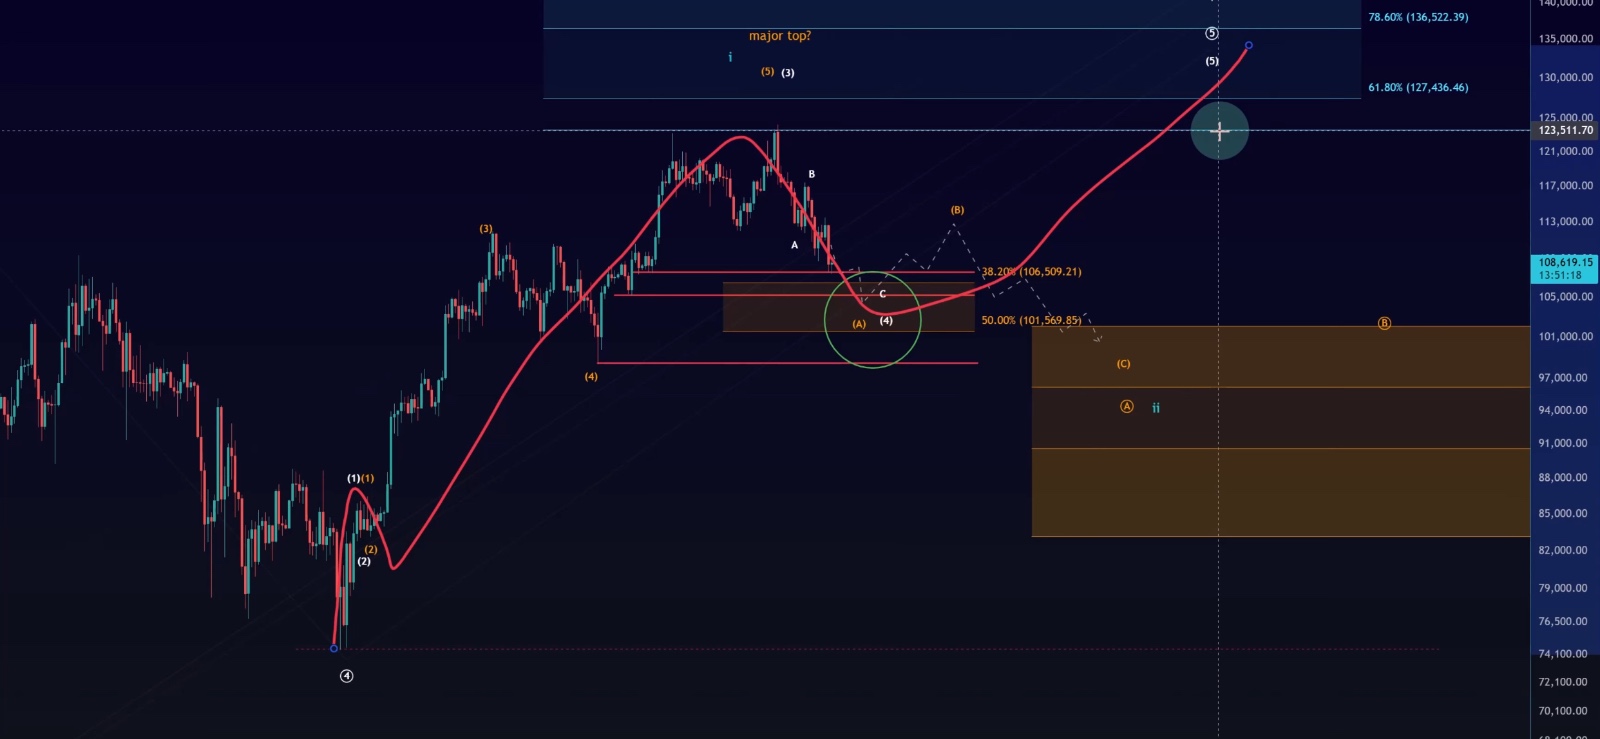
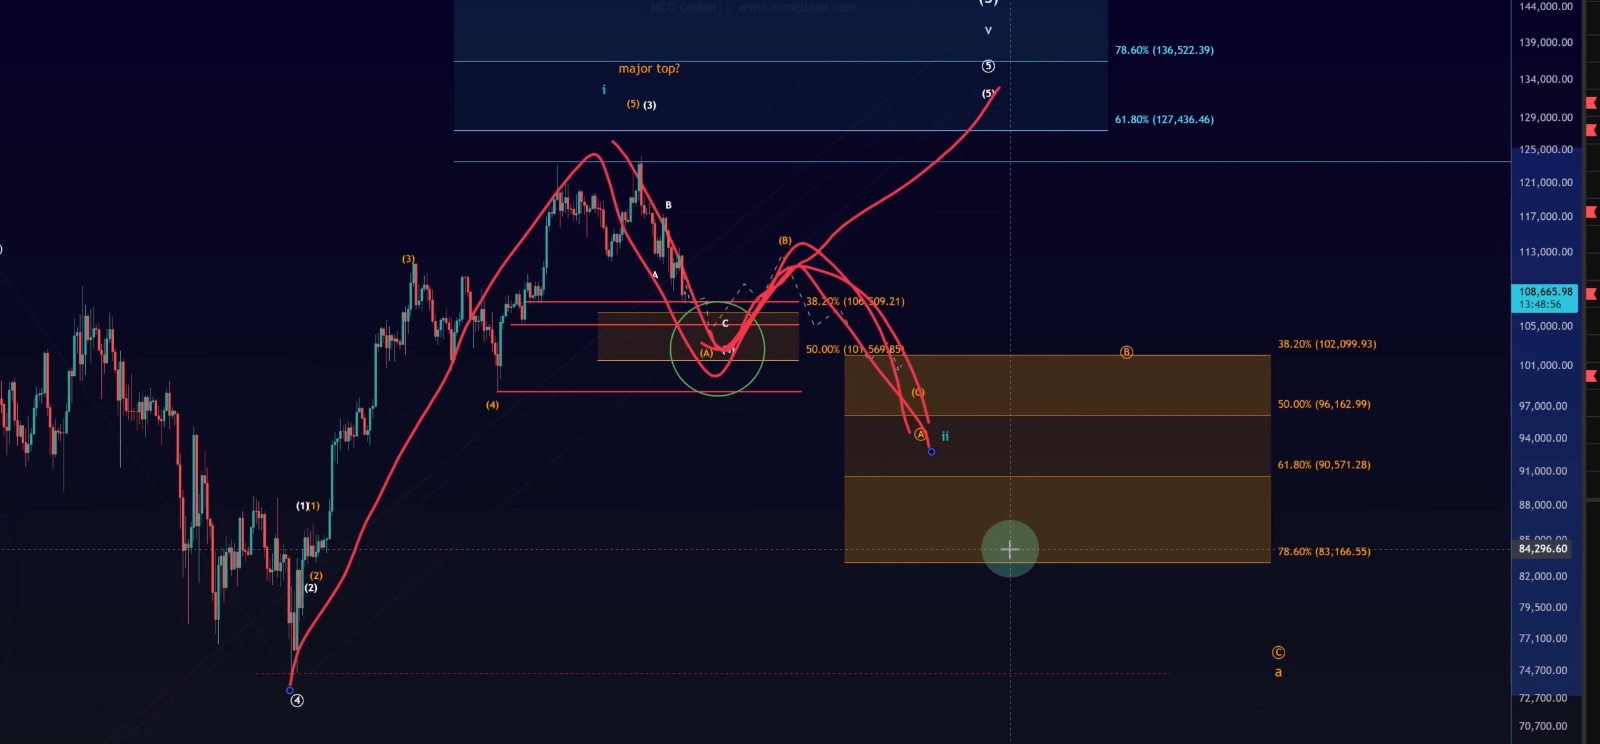
Elliott Wave Scenarios
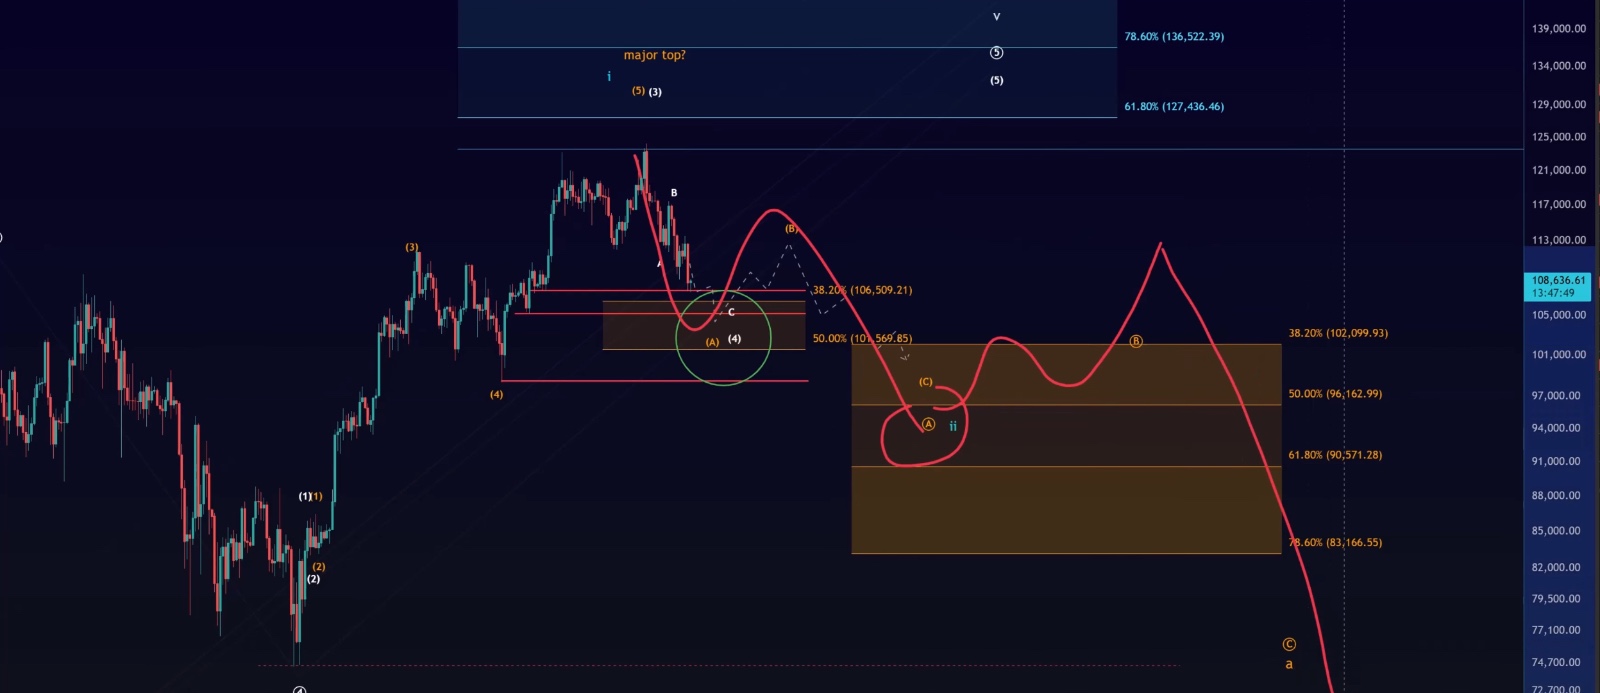
1. White Scenario – Direct Rally to New Highs
•Wave count: 1–2–3–4–5 structure.
•Condition: Price must hold above $111,550 to remain valid.
•Expectation: A bounce from support could lead directly to new highs.
•Potential upside: If a 1–2 setup forms, this could fuel a major Wave 3 rally toward $150,000+.
This scenario would offer strong opportunities for bullish entries, especially if oversold conditions align at lower support levels.
2. Orange Scenario – Ongoing ABC Correction
•Wave A: Initial drop from all-time high.
•Wave B: Corrective bounce.
•Wave C: Still unfolding, possibly with another leg down.
•Support overlap: $102,050 – $101,550 zone becomes critical.
This scenario would extend the correction, delaying bullish continuation and requiring patience for traders awaiting confirmation.
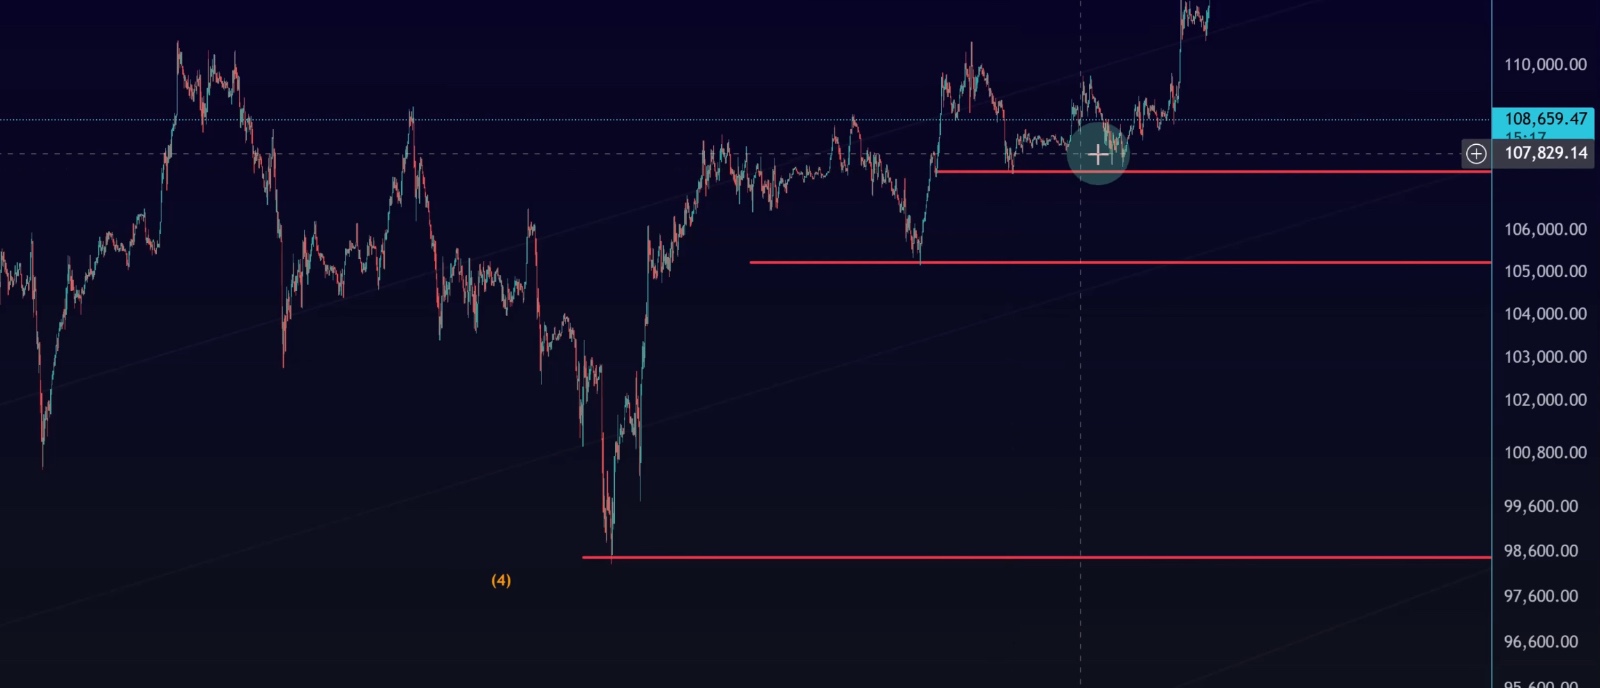
Short-Term Outlook
On lower timeframes, Bitcoin shows signs of weakness but is testing layered supports:
•Immediate supports: $107,400, $106,550, and $105,300.
•Possible bounce zone: Around $101,650–$102,050 if selling pressure continues.
•Short-term resistance zone: $109,674 – $112,173, which may cap weekend rallies.
Given low trading activity expected over the weekend, upside is likely to remain limited unless unexpected volatility enters the market.
Conclusion
Bitcoin is at a critical junction, balancing between two potential paths:
•Bullish White Scenario: Holding $111,550 support could fuel a direct push higher, potentially setting up a Wave 3 rally towards $150K.
•Bearish Orange Scenario: Breaking below layered supports could extend the correction, with deeper targets near $102K or lower.
For now, the microstructure still points lower, but traders should closely monitor support reactions. A clear five-wave bounce from support would be the first signal of a bullish reversal attempt. Until then, all rallies should be treated as corrective and fragile.