
Bitcoin continues to push higher in its corrective structure, moving closer to the $114,000–$115,500 resistance zone. While this bounce has held above support and tested it twice in recent sessions, the market is now entering a region where risk increases significantly.
The Elliott Wave outlook suggests that this move remains corrective rather than impulsive, which means traders should remain cautious as Bitcoin approaches resistance levels.
Support and Resistance Overview
•Support Tested Twice: Since Wednesday, Bitcoin has successfully defended its prior swing low. Yesterday’s bounce from the support region confirmed buyers are still active.
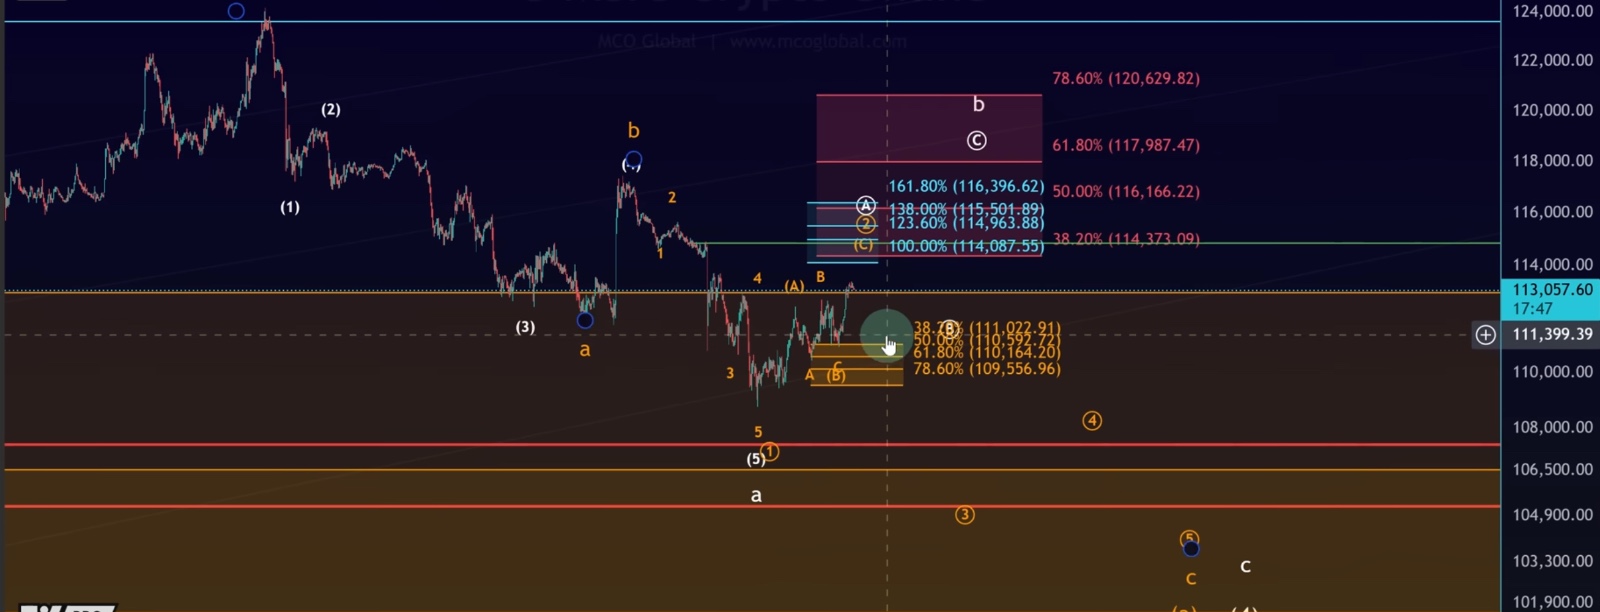
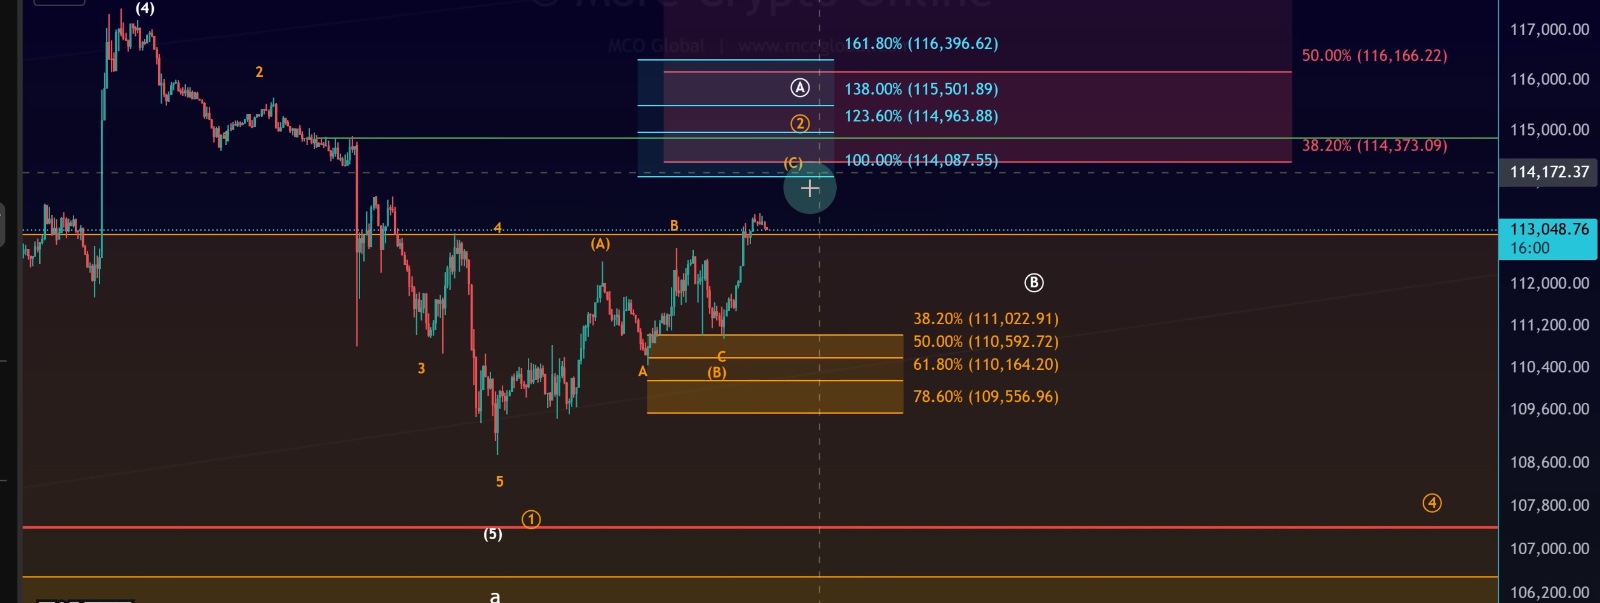
•Immediate Resistance: $114,000 – $115,500 (near the 100% Fibonacci extension).
•Elevated Risk Zone: Moving away from support and closer to resistance increases the likelihood of seller interest returning.
As Bitcoin trades closer to this blue resistance zone, the potential for a local top forming grows stronger.
Elliott Wave Scenarios
At this stage, two key pathways are being tracked on the chart:
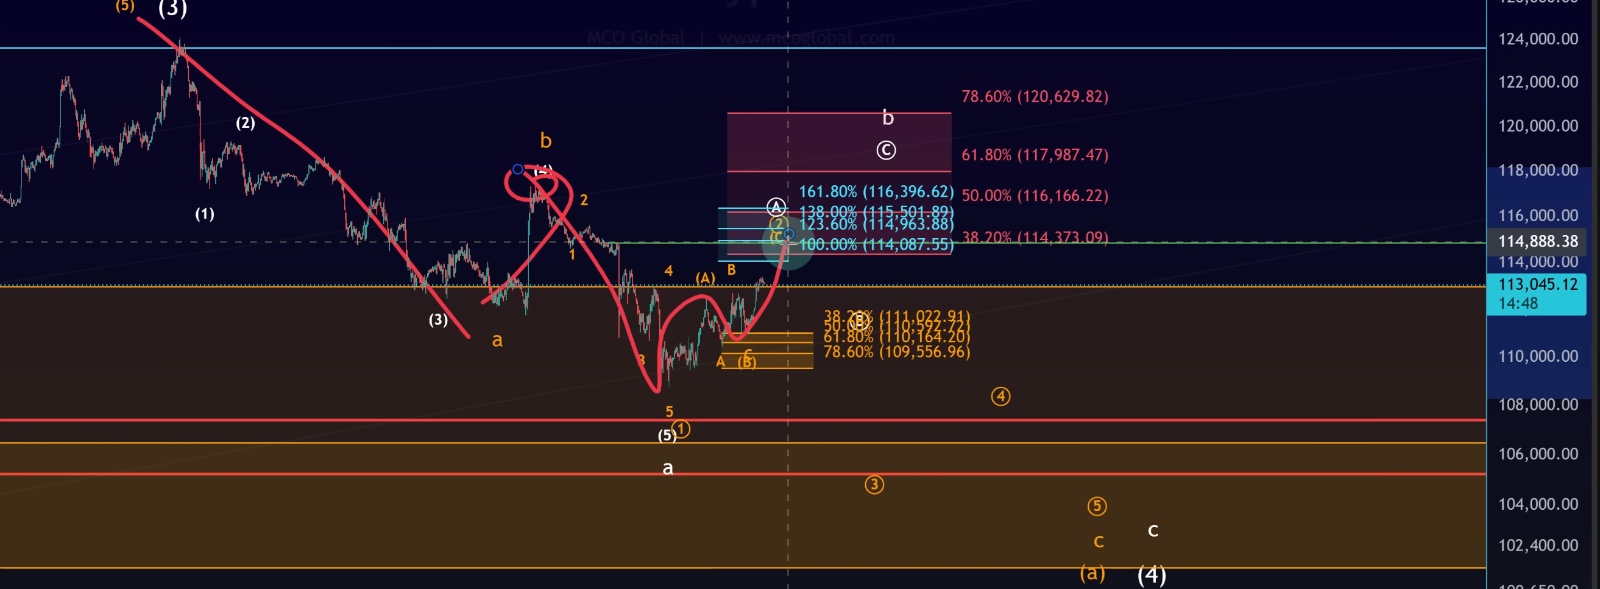
1. Orange Scenario –
Corrective ABC Move
•Wave A: Completed from the all-time high.
•Wave B: First leg of the bounce completed on August 22.
•Wave C: Currently unfolding in a five-wave decline.
•Current Bounce: Seen as a Wave 2 corrective rally within the larger C-wave structure.
•Risk: Elevated around $115,500, where Wave 2 could end and Wave 3 down begins.
This is the bearish corrective outlook, where the current rally is fragile and likely to roll over once the local top is confirmed.
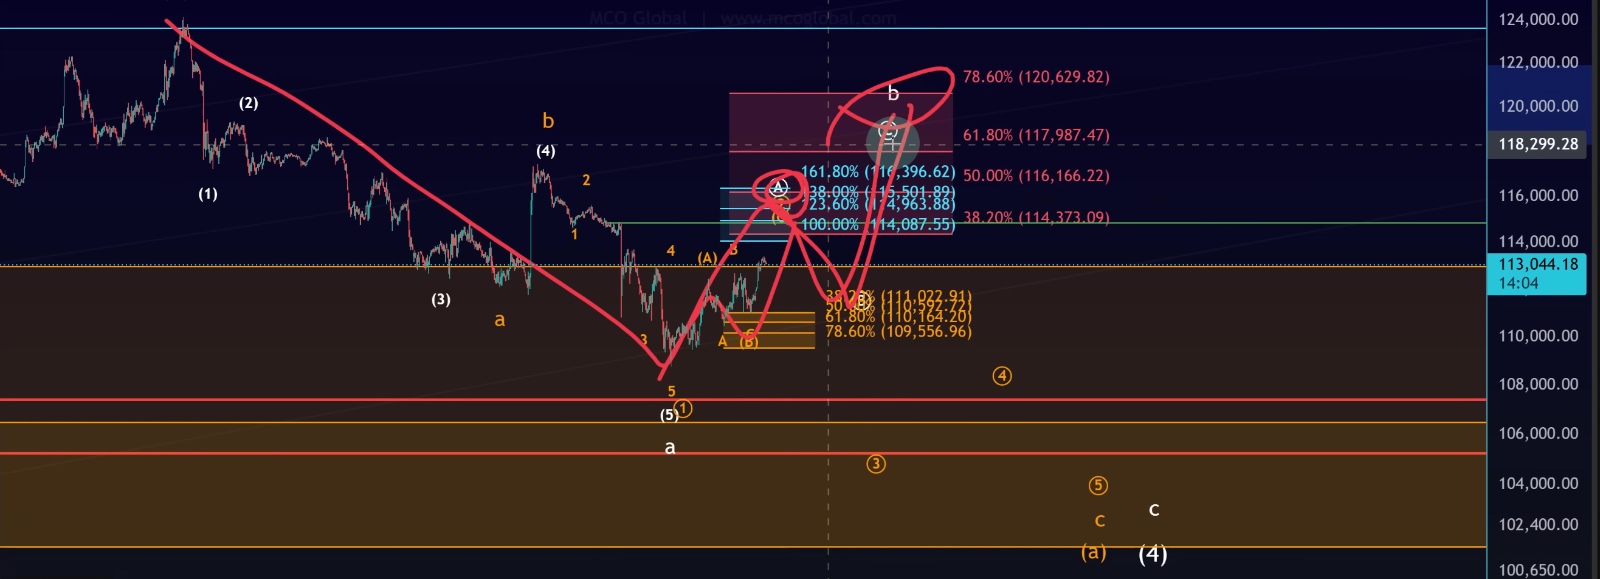
2. White Scenario –
Extended Corrective B-Wave
•Entire move down considered as Wave A.
•Current bounce could represent part of a larger B-wave rally.
•If extended, this could even challenge the all-time high again—but this requires clear evidence and follow-through.
•Pathway: After this B-wave completes, a C-wave pullback would be expected.
This is the more bullish corrective outlook, but still corrective in nature until proven otherwise.
Short-Term Outlook
•Bitcoin is approaching $114K–$115.5K, which represents a high-risk zone for bulls.
•Once a local top is confirmed, the next support zone will be added to the chart.
•Until then, this bounce should be treated as fragile and corrective, not a trending move.
Traders should stay alert:
•If Bitcoin breaks above $115.5K with strength, the White B-wave scenario gains weight.
•If Bitcoin stalls and reverses here, the Orange C-wave decline could begin.
Conclusion
Bitcoin’s rally from support has brought it closer to the critical resistance area around $114,000–$115,500. While short-term momentum has carried BTC higher, this move remains corrective and fragile.
•Orange Scenario: A Wave 2 corrective bounce, with risk of a sharp Wave 3 decline ahead.
•White Scenario: A broader B-wave rally, potentially extending higher before the next corrective pullback.
Until the local top is confirmed and the next support zone is established, traders should approach this rally with caution. Risk is elevated as BTC approaches resistance, and the corrective structure suggests volatility is far from over.