
We’ve finally seen the bounce we’ve been waiting for — and it’s unfolding just as outlined in previous updates. A few days ago, I highlighted the support region between $105,350 and $107,750 as a key zone to watch. Back on the 29th, I mentioned that this range could offer support and potentially trigger a bounce, even though at that time there was no clear evidence of one starting. Since then, the market has respected this level, and the bounce has materialized.
Now, the important question is: where does Bitcoin go from here?
Support Still Holding Strong
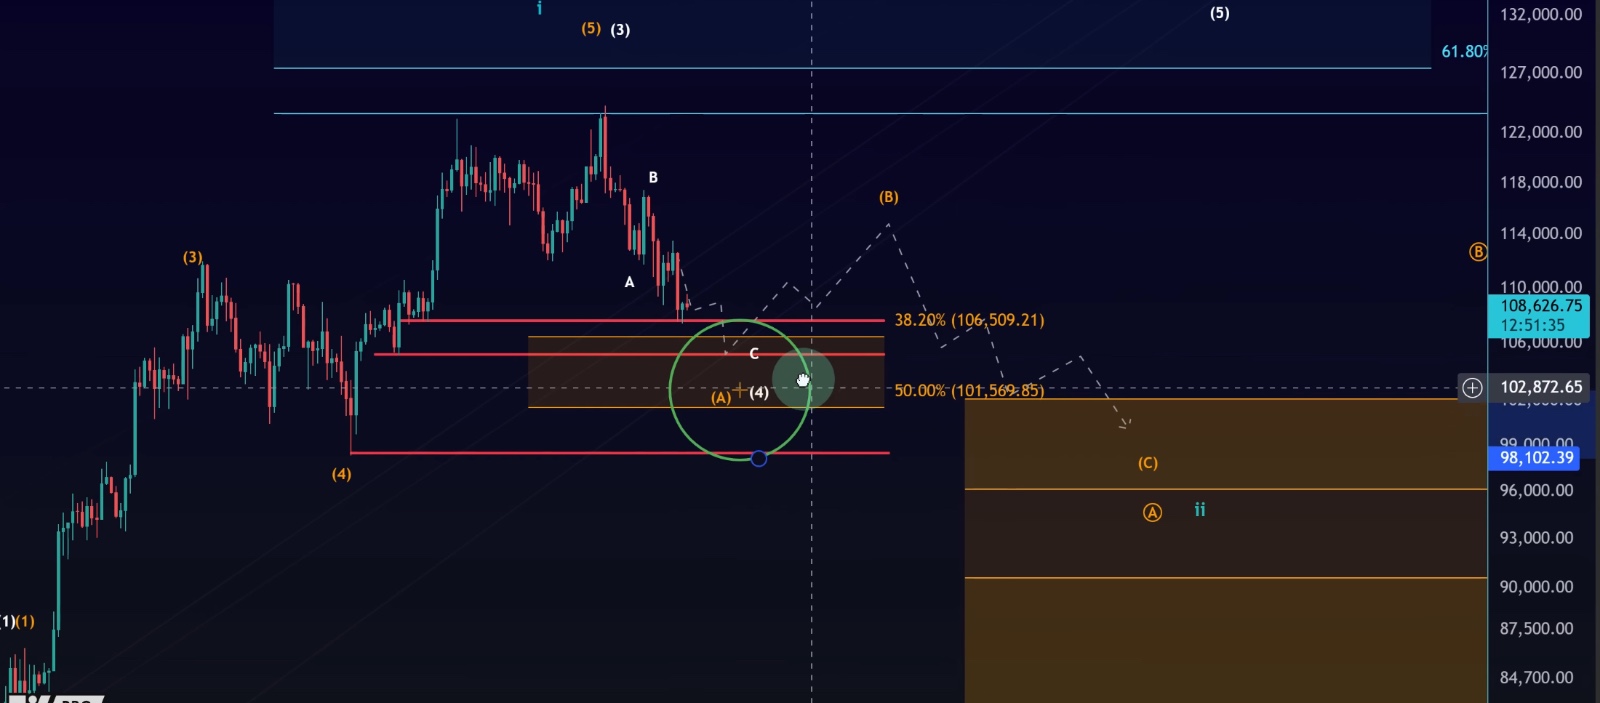
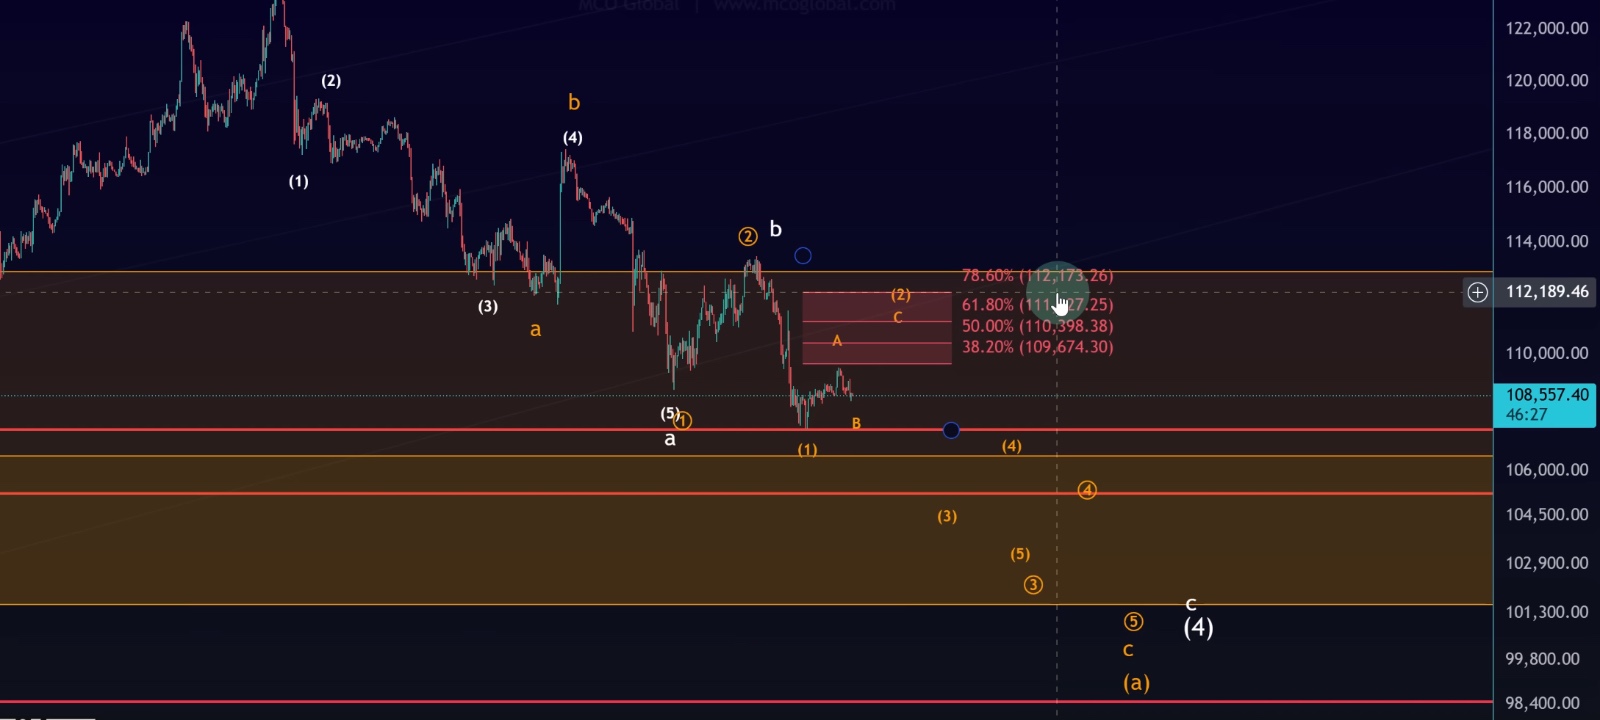
The price bounced exactly from the lower support zone around $106,500, and as of now, this area is proving significant. On the daily chart, this region also aligns with Fibonacci support levels, making it even more important.
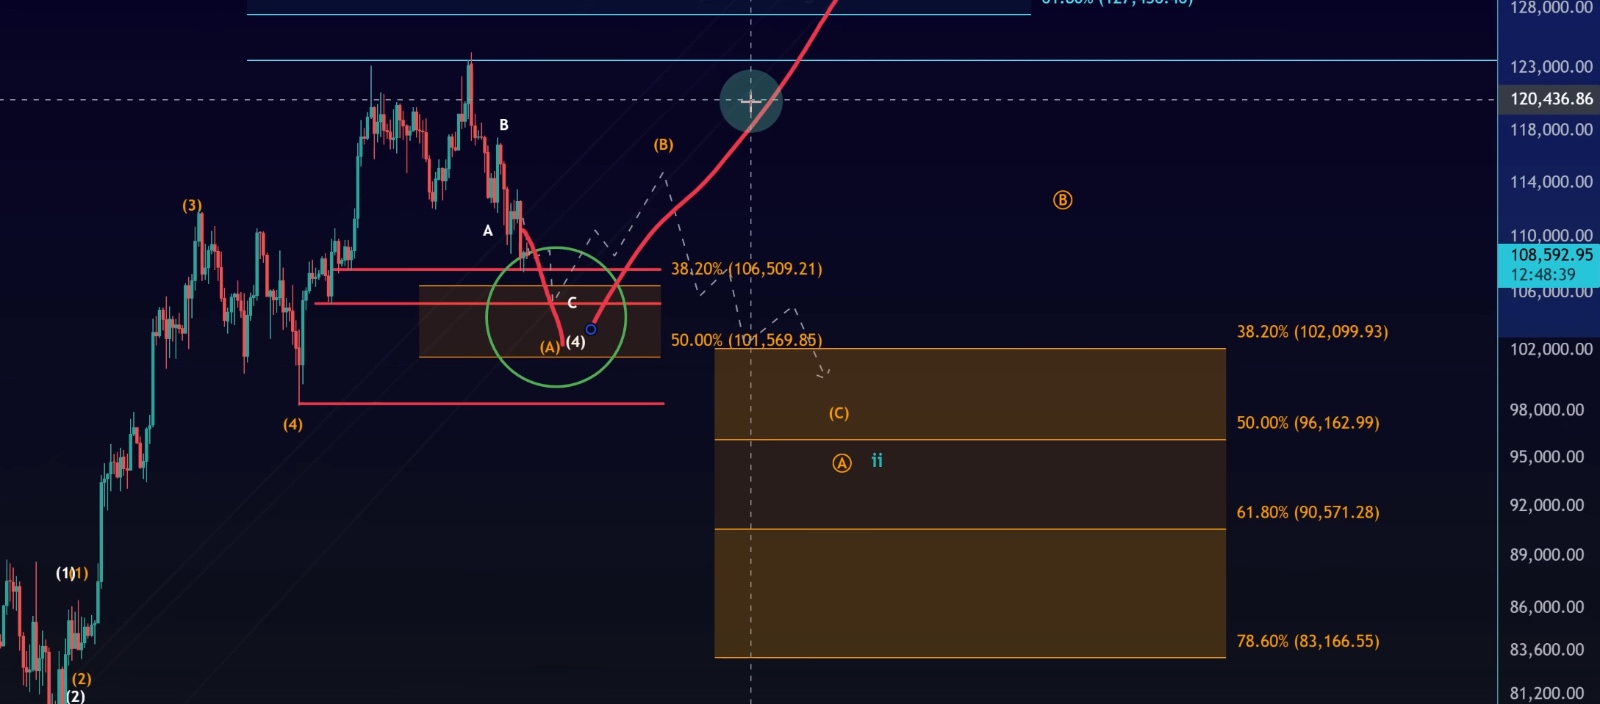
As long as Bitcoin is holding $101,570, the possibility of this entire structure being a wave 4 correction remains very much valid. This means the bullish pathway is still on the table, and we could see continuation higher into a fifth wave.
So, to be clear — I am not bearish on Bitcoin here. Short-term downside pressure is visible, yes, but in the bigger picture, support is intact and bullish outcomes remain likely.
Resistance Levels to Watch
The next step is to see whether bulls can take the lead. For that, we need more than just a green candle. The nearest resistance that matters sits around $112,170.
•A break above $112,170 would be the first real sign that bulls are regaining control.
•To fully invalidate the short-term 1–2 downside setup, we’d need to break $113,520.
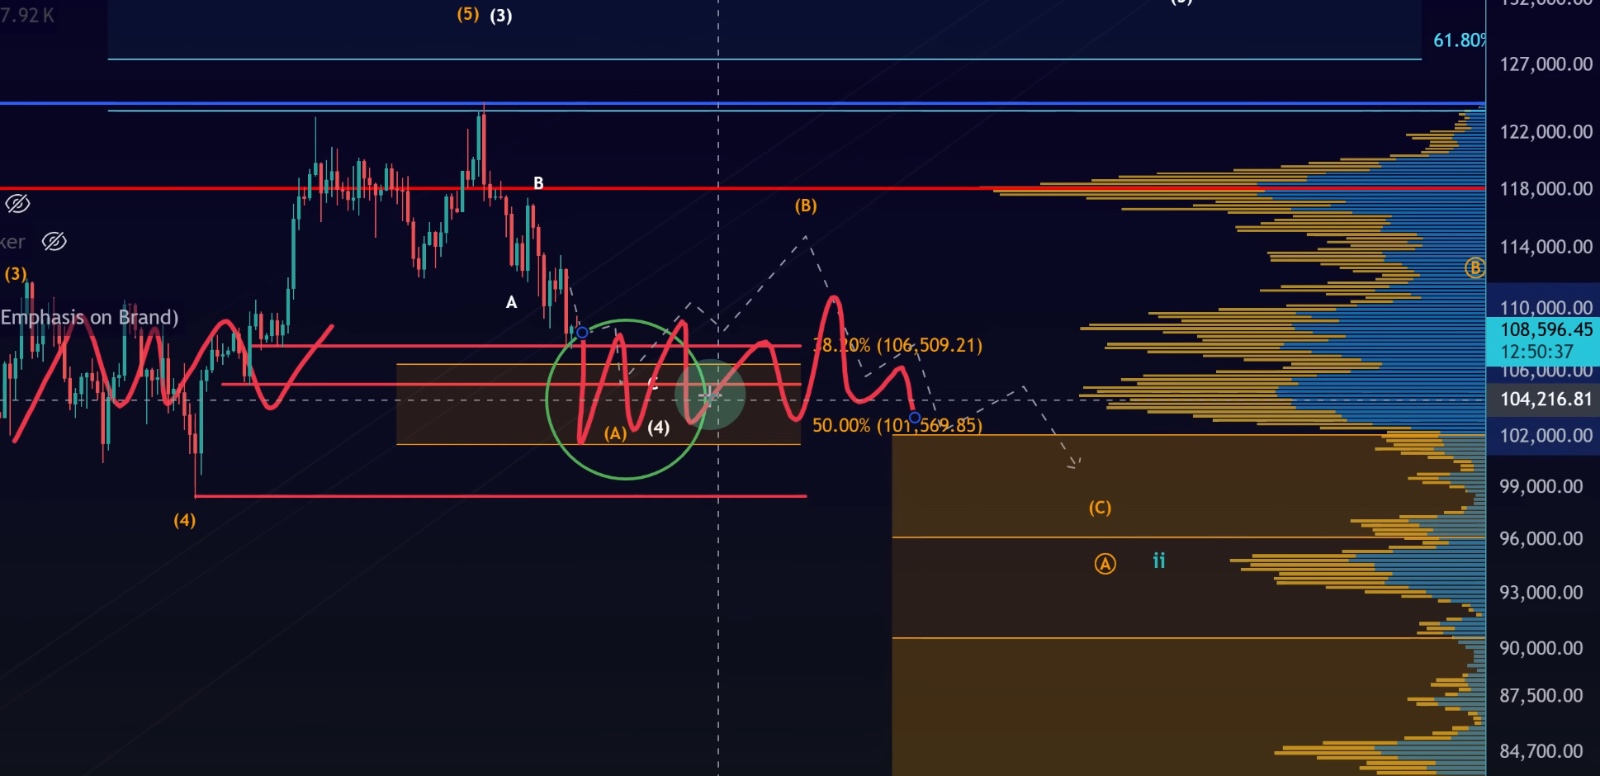
If Bitcoin manages to clear these levels, it opens the door for a test of the previous swing high around $117,400. Beyond that, the point of control on the VRVP sits near $118,000, which could act as a major resistance cluster before any push to new all-time highs.
The Short-Term Picture
On the smaller time frame, we’ve been watching for this C-wave bounce to unfold — and that’s exactly what we’re seeing. The market shook out longs, held support at $107,400, and now the C-wave is pushing higher.
But — and this is important — so far it’s still a three-wave move up, which is corrective in nature. Unless we see a clear five-wave impulsive structure breaking resistance, the upside remains suspect.
So, short-term momentum is definitely bullish, but I want to see confirmation before trusting it.
Key Takeaways
1.Support is intact around $106,000 – $107,500.
2.As long as $101,570 holds, this remains a potential wave 4 correction.
3.First bullish signal: Break above $112,170.
4.Full bearish invalidation: Break above $113,520.
5.If cleared, price could test $117,400 – $118,000, before targeting new highs.
Final Thoughts
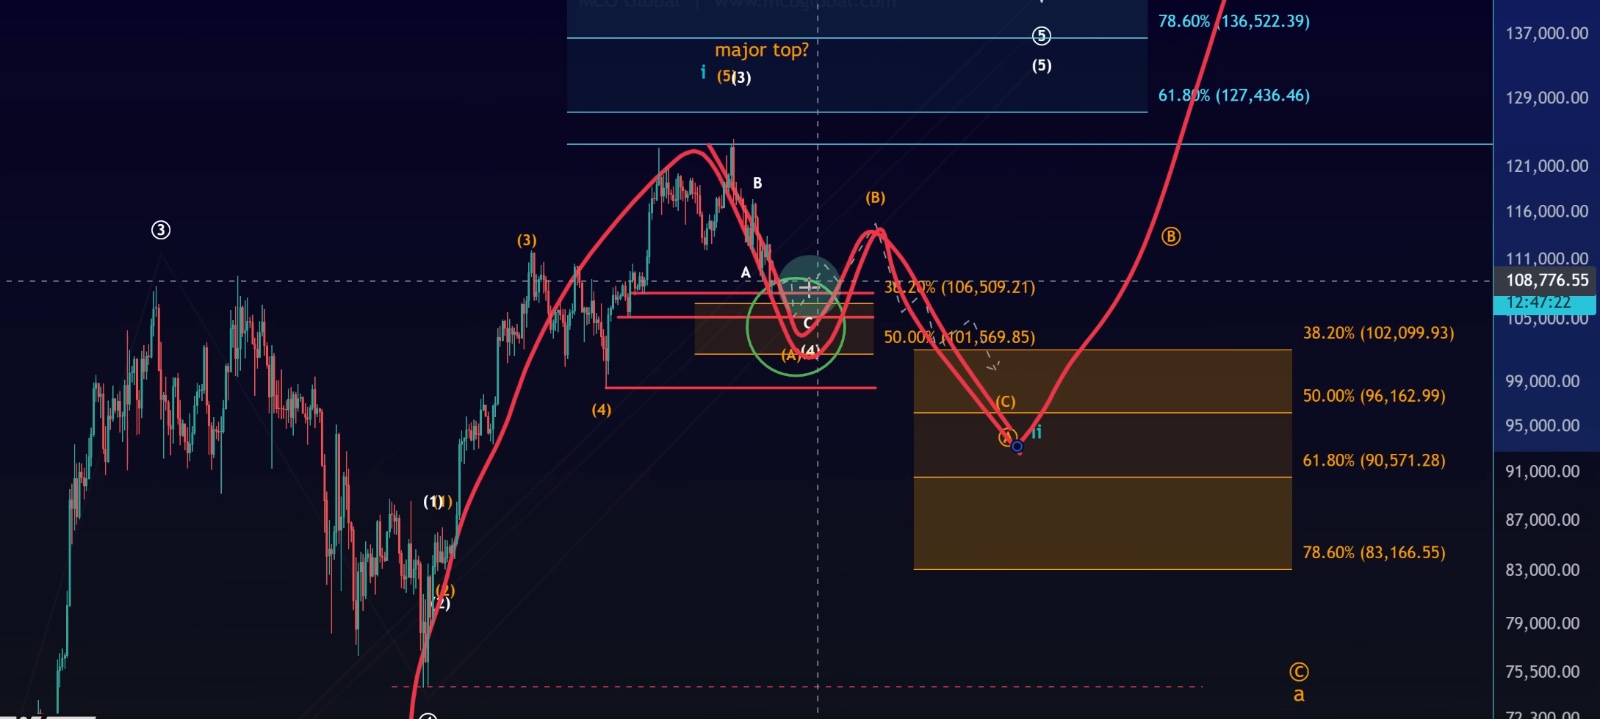
Yes, September is historically one of Bitcoin’s toughest months, but that doesn’t mean it’s all downside. The structure we are seeing is still aligned with possible bullish pathways. Whether Bitcoin goes directly higher from this $106K zone in a fifth wave, or whether it first completes a larger corrective pullback before resuming its uptrend, both bullish scenarios are still valid.
For now, the bounce is here, but we need stronger evidence — ideally a break of resistance and a five-wave move up — to confirm that the next larger rally is underway.