
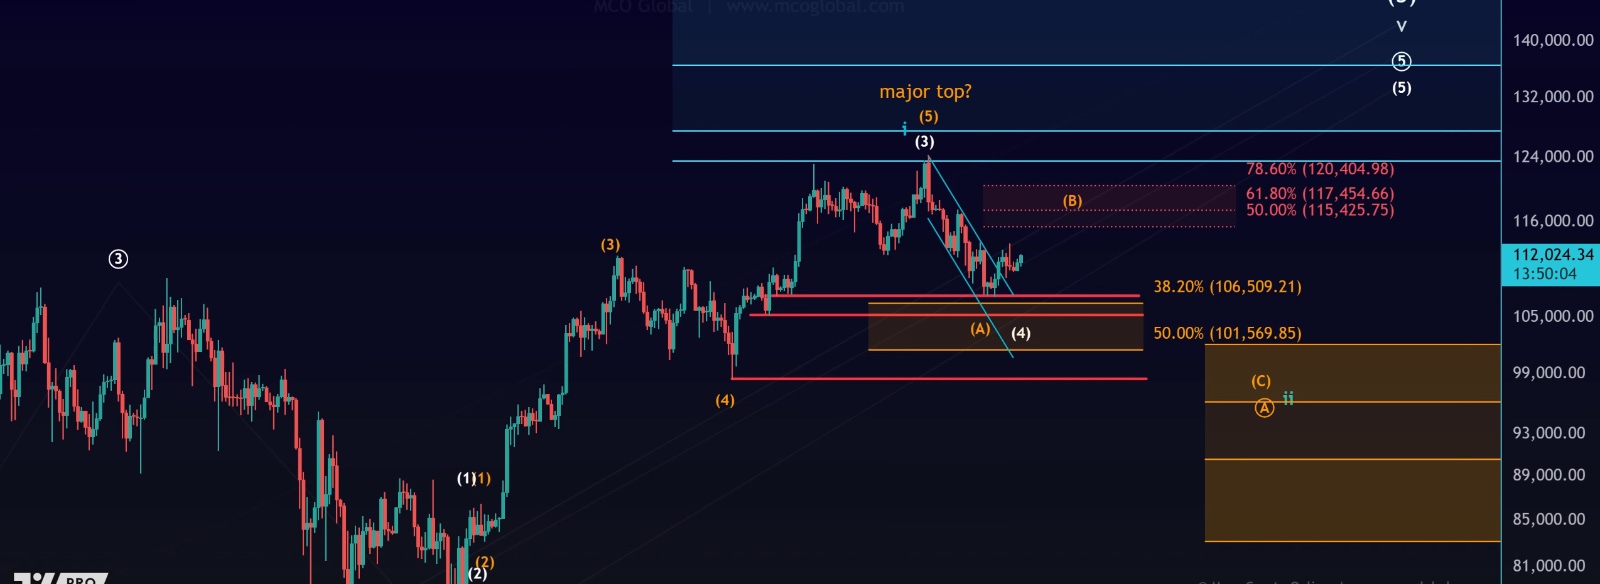
 Hello everyone, and welcome back to another Bitcoin market update. On the daily time frame, there isn’t much new price action to report—Bitcoin is simply following the roadmap we’ve discussed in previous updates. After bouncing off support, the market is now moving toward a key resistance zone between $115,425 and $120,400.
This range will likely define the week ahead, especially with macroeconomic narratives dominating the discussion.
Resistance Levels and VRVP
• Primary resistance zone: $115,425 – $120,400
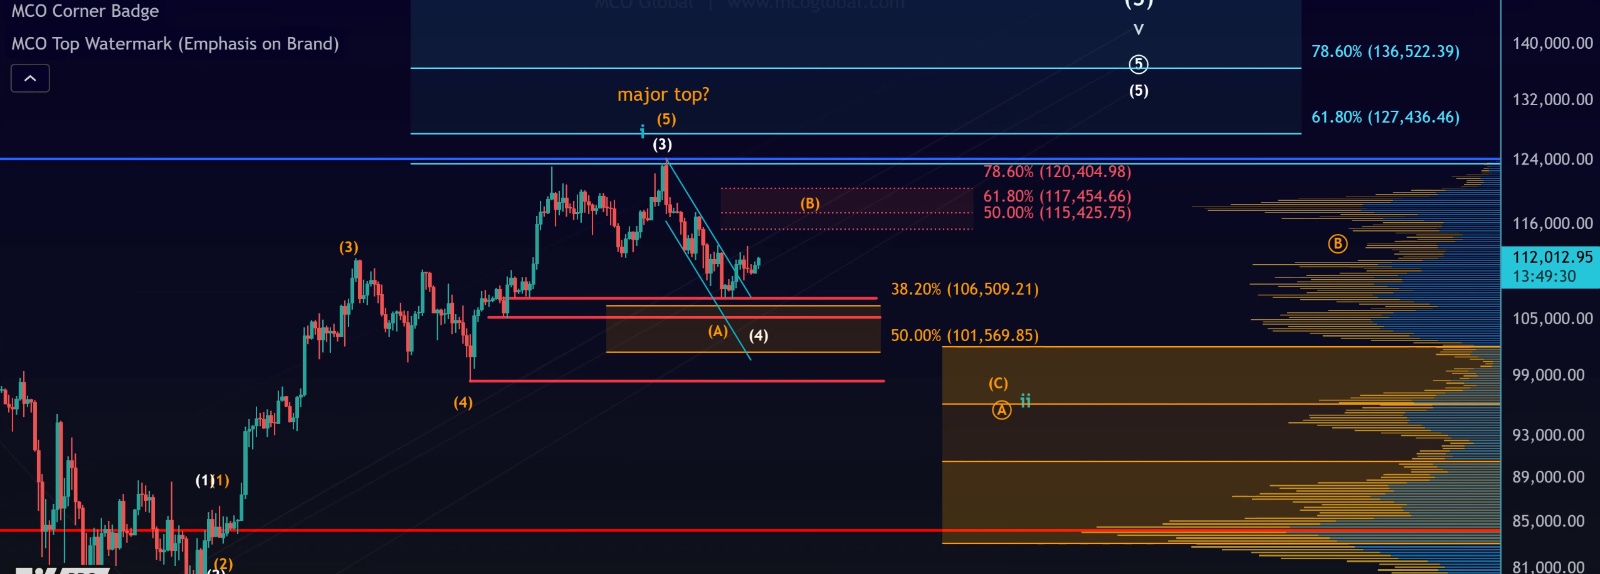
• The VRVP indicator shows heavy historical interest around $118,500, making this a key pivot to watch.
• For now, Bitcoin continues to hold above all major swing lows (June and July) and remains well within the bullish structure.
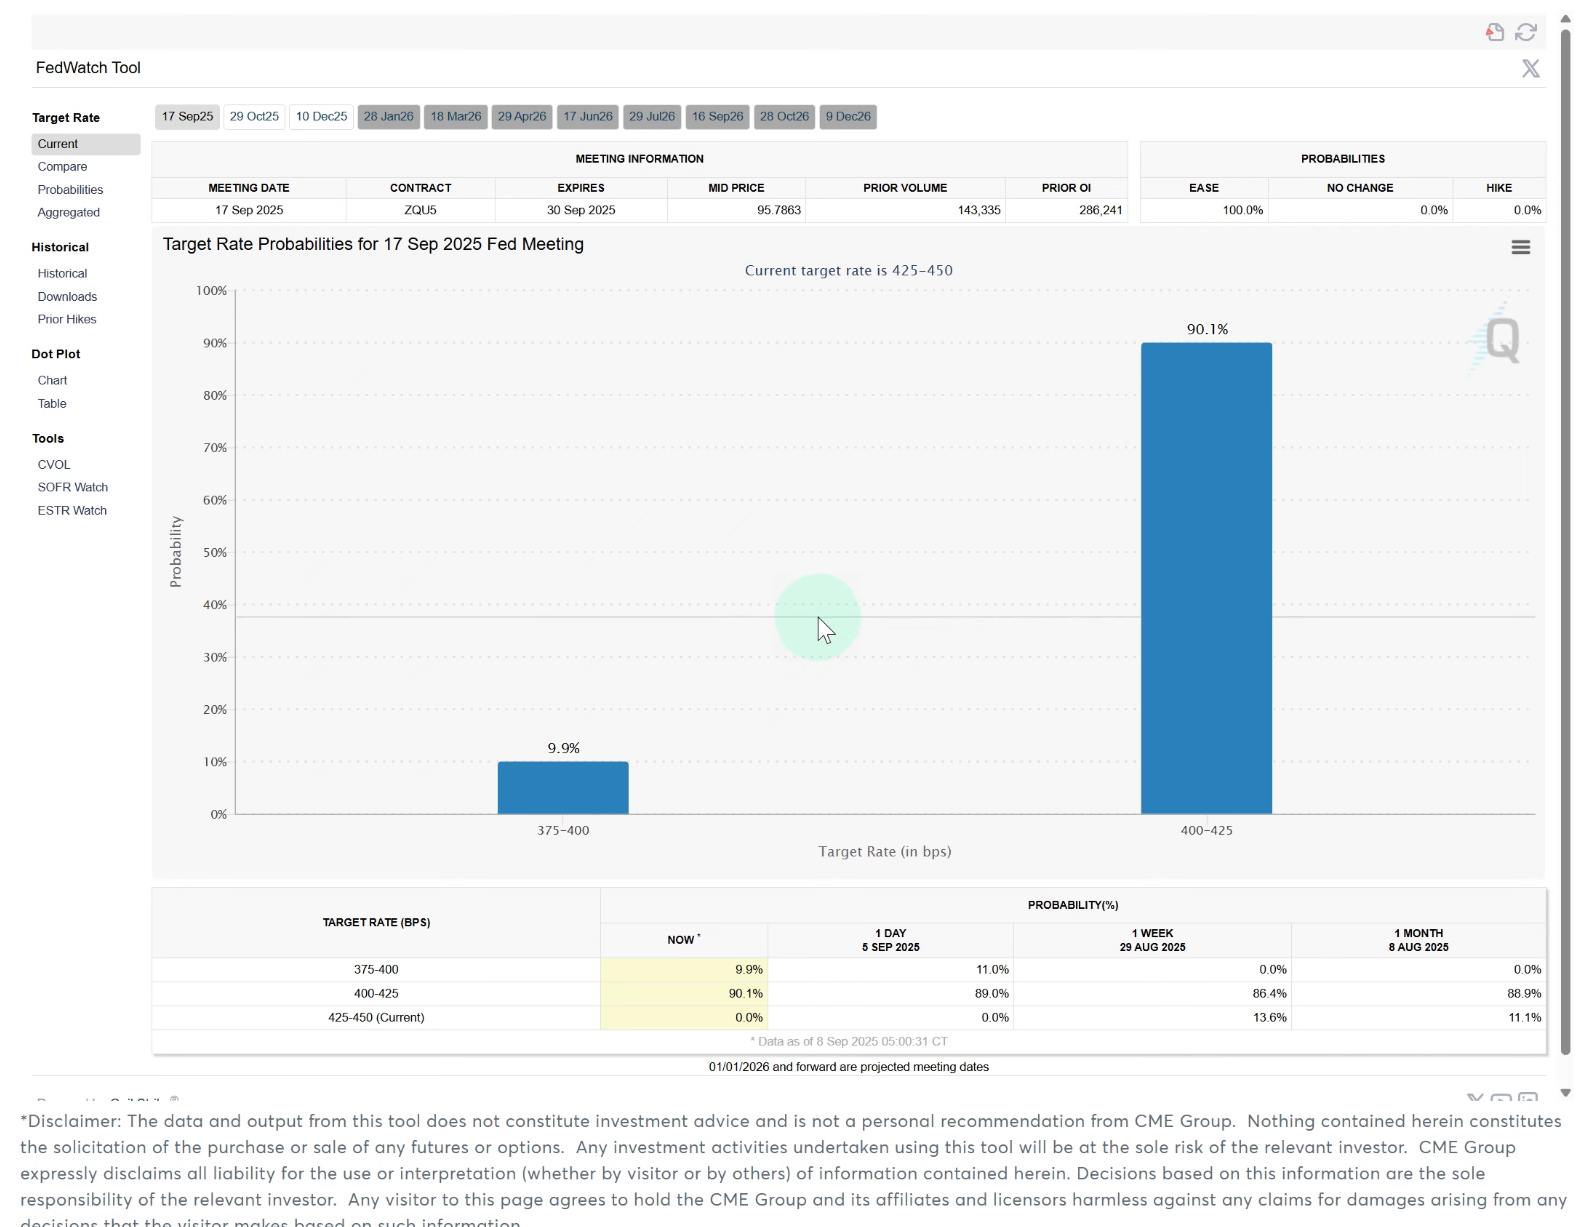
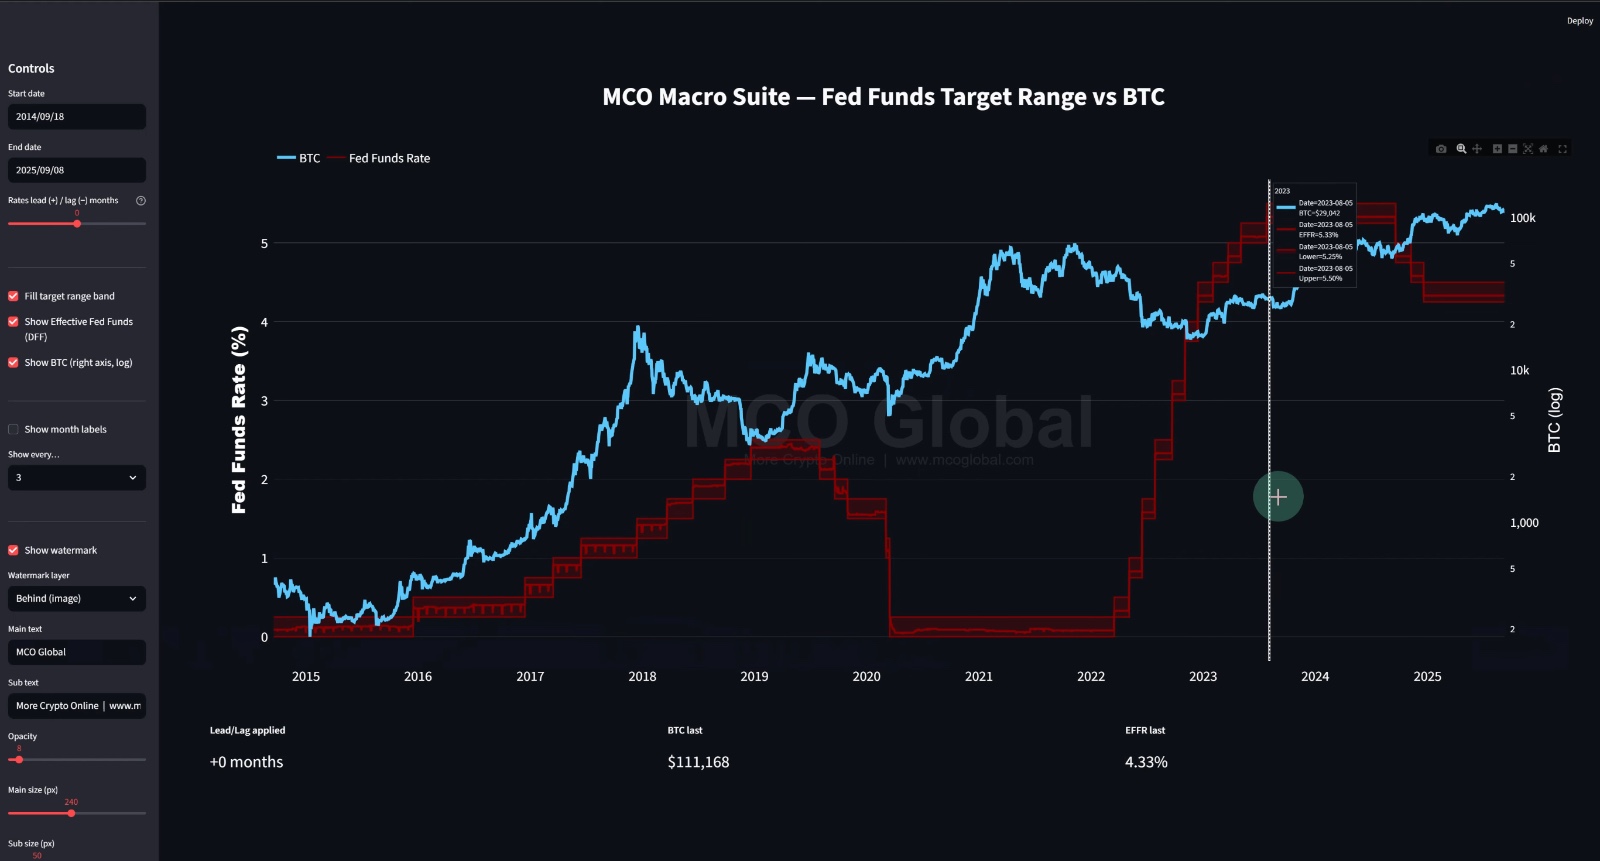
Fed Interest Rate Decision Looming
In 9 days, the Federal Reserve will announce its next interest rate decision. While this isn’t a direct driver of Bitcoin, it’s already dominating headlines and may shape short-term sentiment.
According to the CME FedWatch Tool:
• 90% probability of a 25 bps rate cut
• 10% probability of a 50 bps cut
If the larger cut happens, volatility could spike since markets haven’t priced it in fully.
But does this actually matter for Bitcoin?
The short answer: not as much as people think.
Looking at historical data:
• Bitcoin has both risen and fallen while rates were going up.
• Bitcoin has also surged during rate cuts, but not in a consistent, causal way.
• For example, the 2022 bottom occurred while rates were still zero, and the 2023–2025 bull market unfolded even as rates rose.
👉 Takeaway: While Fed policy influences global liquidity, Bitcoin’s price action is best tracked through wave structures and technicals rather than social media narratives.
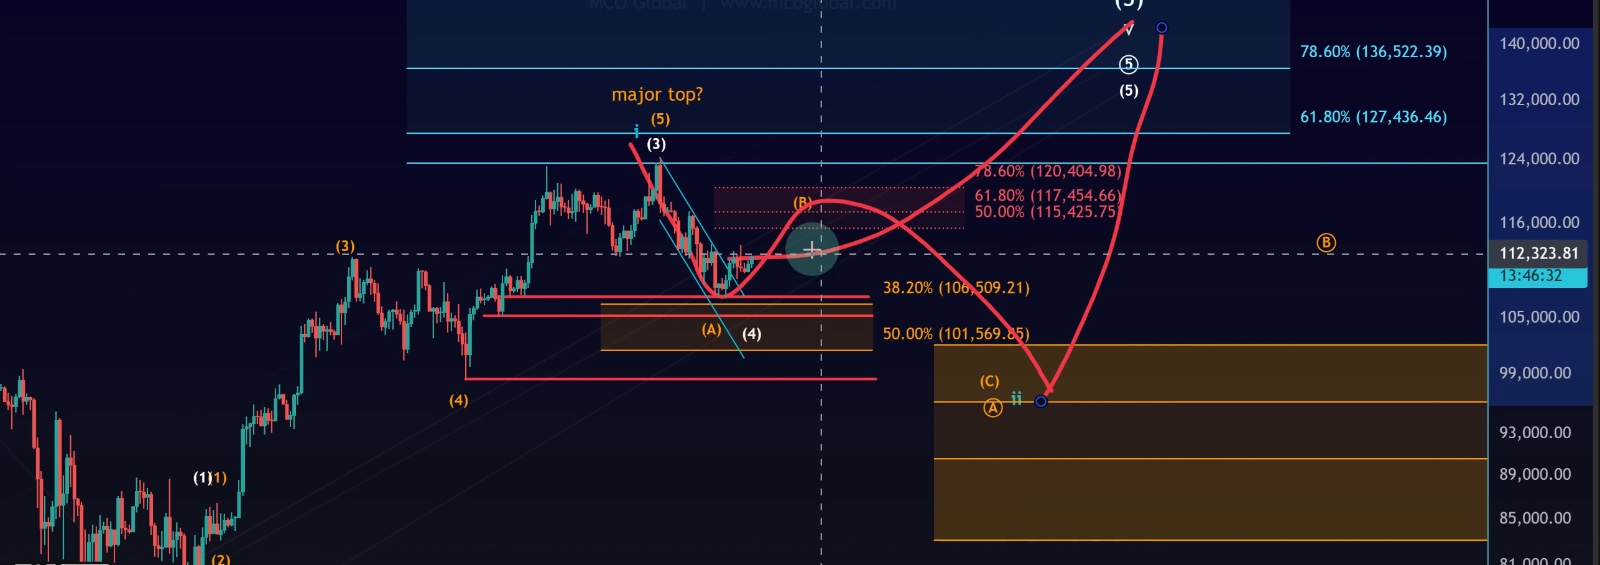
Elliott Wave Structure
The Elliott Wave outlook remains unchanged:
• We could be unfolding a B-wave bounce into the $115K–$120K resistance zone.
• After that, a C-wave decline is possible before continuation higher.
• Alternatively, Bitcoin may take the direct path toward $130K+.
Either way, the larger trend remains bullish as long as key supports hold.
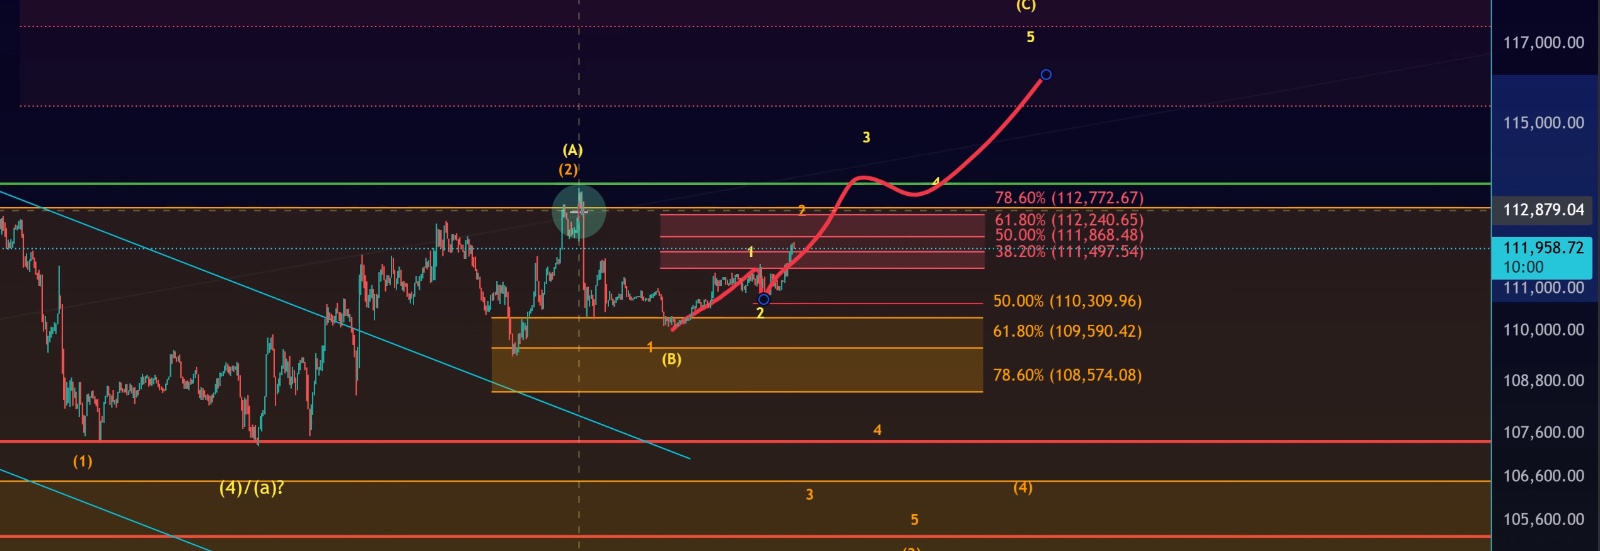
Short-Term (Micro Levels)
On the 30-minute chart:
• Micro support: $108,570 – $110,310
• Micro resistance: $111,500 – $112,770
Price is currently stuck between these ranges, producing nothing more than noise until a breakout occurs.
• A break above $112,770 could open the path toward the broader resistance zone at $115K–$120K.
• A dip back into support would simply extend the B-wave but wouldn’t change the larger bullish outlook.
At the nano-level, today’s structure resembles a micro five-wave push higher, followed by a corrective three-wave pullback—suggesting another grind upward may be in progress.
Conclusion
• Bitcoin is sideways and consolidating, awaiting a breakout.
• The $115K–$120K resistance zone remains the key level to watch this week.
• The Fed rate decision may spark volatility, but historical data shows no clear correlation between interest rates and Bitcoin’s trend.
• Elliott Wave counts still favor higher prices, either directly or after a more extended correction.
For now, the focus remains on levels, structure, and risk management—not on hype or narratives.