
On the daily time frame, Bitcoin’s structure remains largely unchanged. The market is still consolidating within a broader corrective framework, but recent developments suggest that we should stay prepared for either a more direct move higher or a prolonged corrective rally.
Breakout From the Price Channel
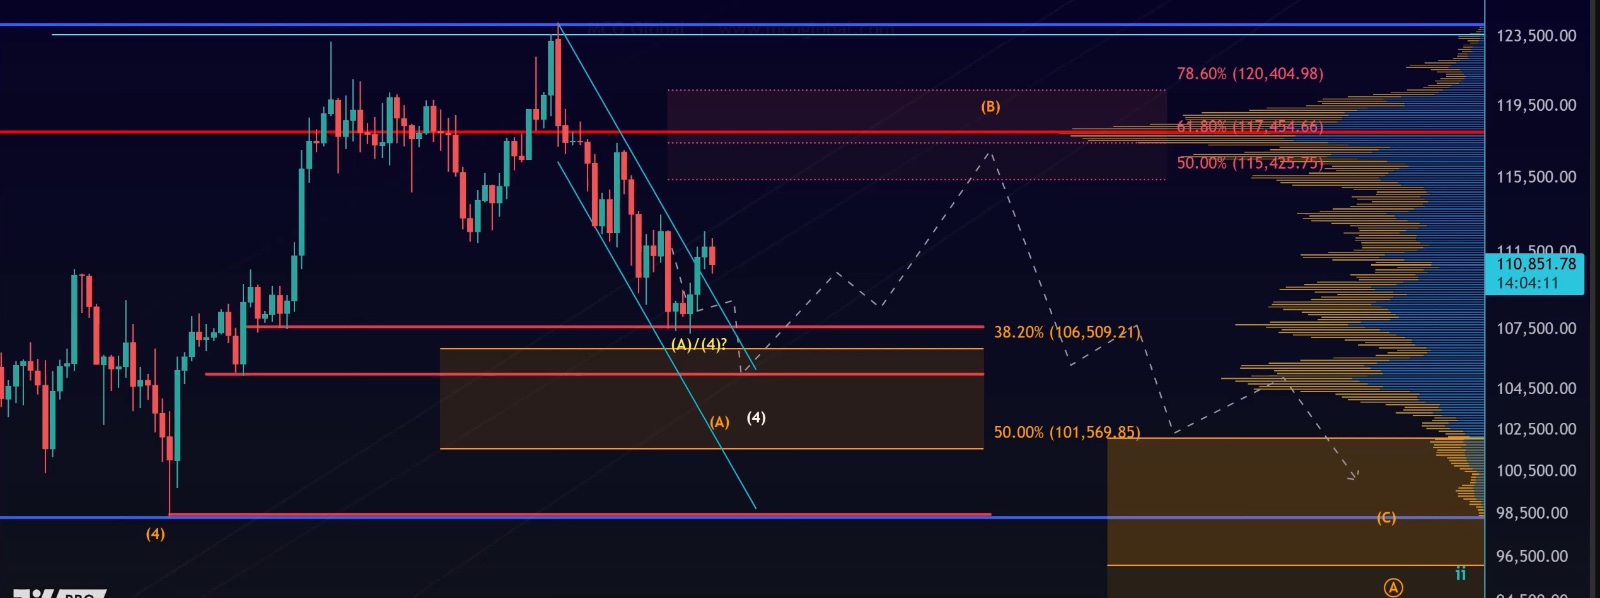
• Bitcoin struck its most recent all-time high around August 14th before entering a downward price channel.
• Some traders have referred to this as a wedge, but the channel representation fits more cleanly.
• Importantly, Bitcoin has now had two daily candle closes above the channel’s upper boundary, which signals that a potential low may be in place.
• That said, the move higher still looks corrective and overlapping—not yet a clear five-wave impulsive rally as required by Elliott Wave theory.
Why the Rally Looks Corrective
• At present, the upside movement appears choppy and lacks the clear structure of a new bullish impulse.
• Without a five-wave move up or a break above Fibonacci resistance, it’s too early to call this a confirmed bottom.
• Corrective rallies often fail, which is why caution remains key.
Key Levels on the Daily Chart
1. Support
• Price recently respected the $107,400 level, bouncing cleanly from it.
• This aligns with a support cluster on the VRVP indicator, strengthening its significance.
2. Resistance
• Major Fibonacci resistance lies between $115,425 and $120,404.
• The Point of Control (PoC) on VRVP is also in this zone, around $118,000, reinforcing this area as a liquidity magnet.
• Heat maps show heavy liquidity clustered here, which could attract price in the coming weeks.
Seasonal Outlook
• Historically, September has been the weakest month for Bitcoin.
• However, Bitcoin often moves contrary to expectations, meaning a bearish bias isn’t guaranteed.
• Q4 (October–December) has statistically been the strongest quarter, which could support a recovery if September remains subdued.
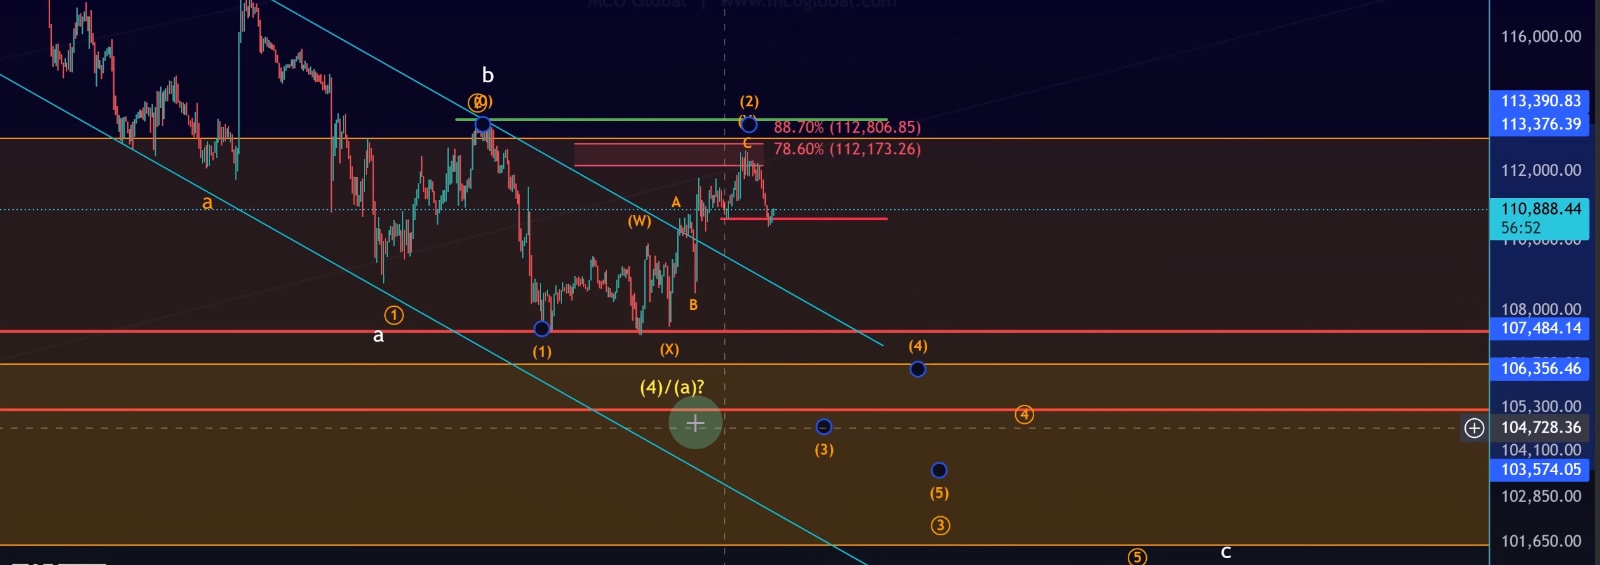
Smaller Time Frame: Watching the WXY Pattern
• On lower time frames, Bitcoin has formed a three-wave structure (WXY) from the August 30th low.
• This suggests the move is still corrective.
• Price failed to break the 78.6% retracement level, getting rejected exactly where the bearish (orange) scenario required.
• As long as no five-wave decline has formed, the market has not confirmed a new downward trend.
Scenarios to Watch
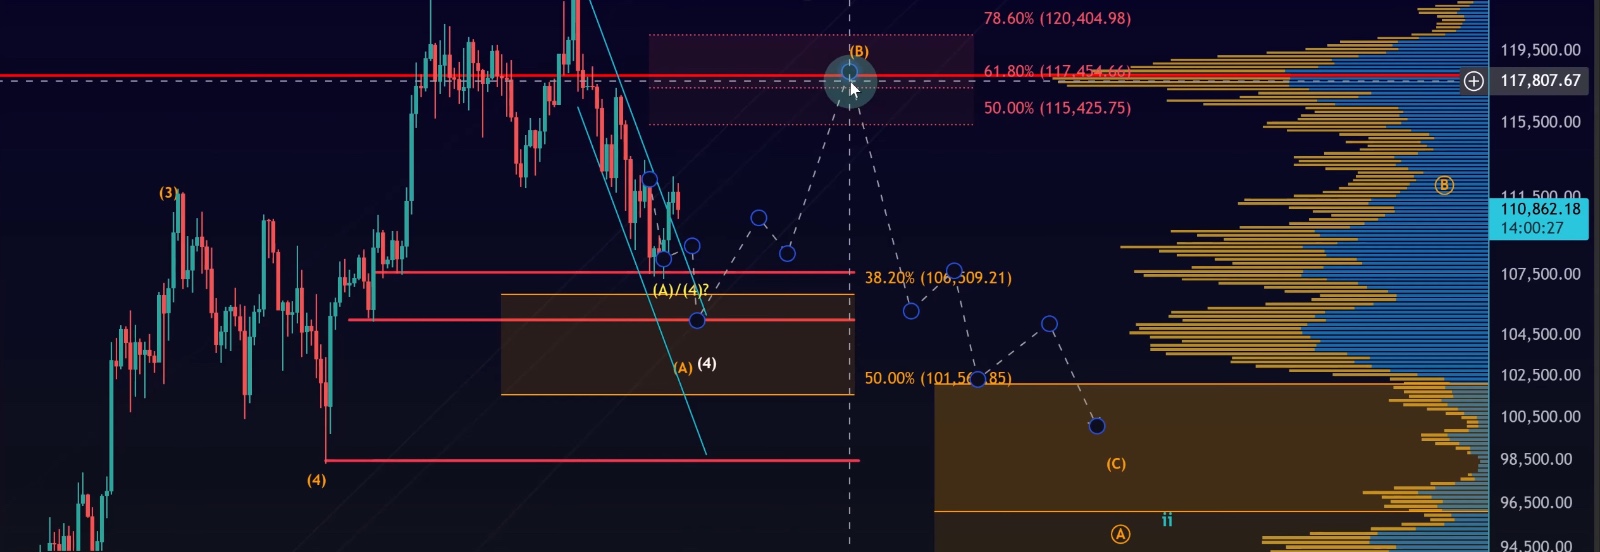
1. Bullish Scenario
• A break above the green invalidation line would shift focus towards the $115K–$120K resistance zone.
• If the move gathers momentum, this could be interpreted as a wave four bottom leading into a more direct path higher.
2. Bearish Scenario
• A five-wave move down along with a break back into the channel would confirm a meaningful top.
• This would suggest a C-wave decline is underway, with lower support levels back in play.
Conclusion
Bitcoin continues to hover between well-defined support and resistance levels, with no clear resolution yet.
• Support: $107,400.
• Resistance: $115,425–$120,404 (with PoC at $118,000).
The longer Bitcoin holds above the channel boundary, the greater the chances of a larger corrective rally toward $118K. However, without a confirmed impulsive structure, traders should remain cautious and manage risk carefully.