
A Quick Refresh on the Daily Chart
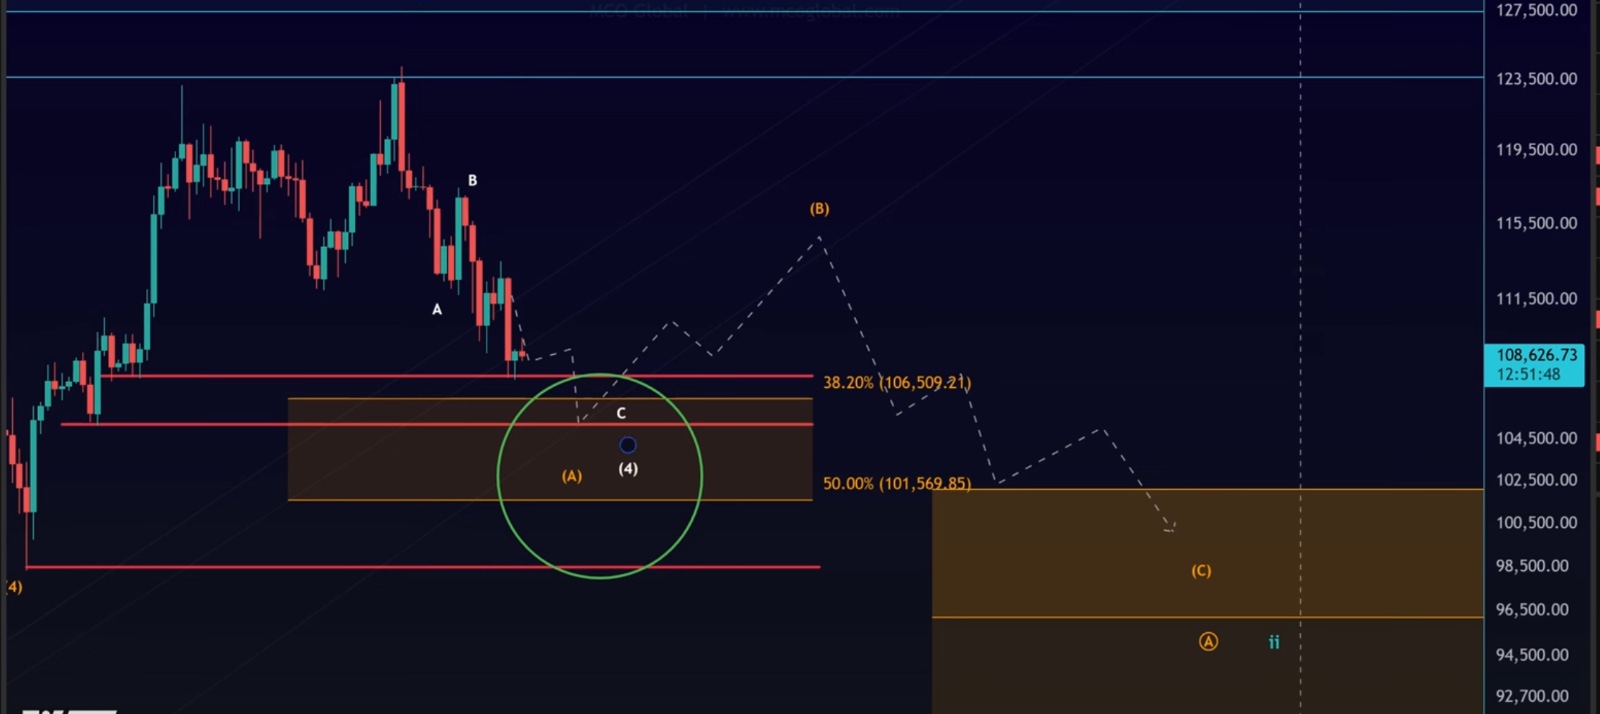
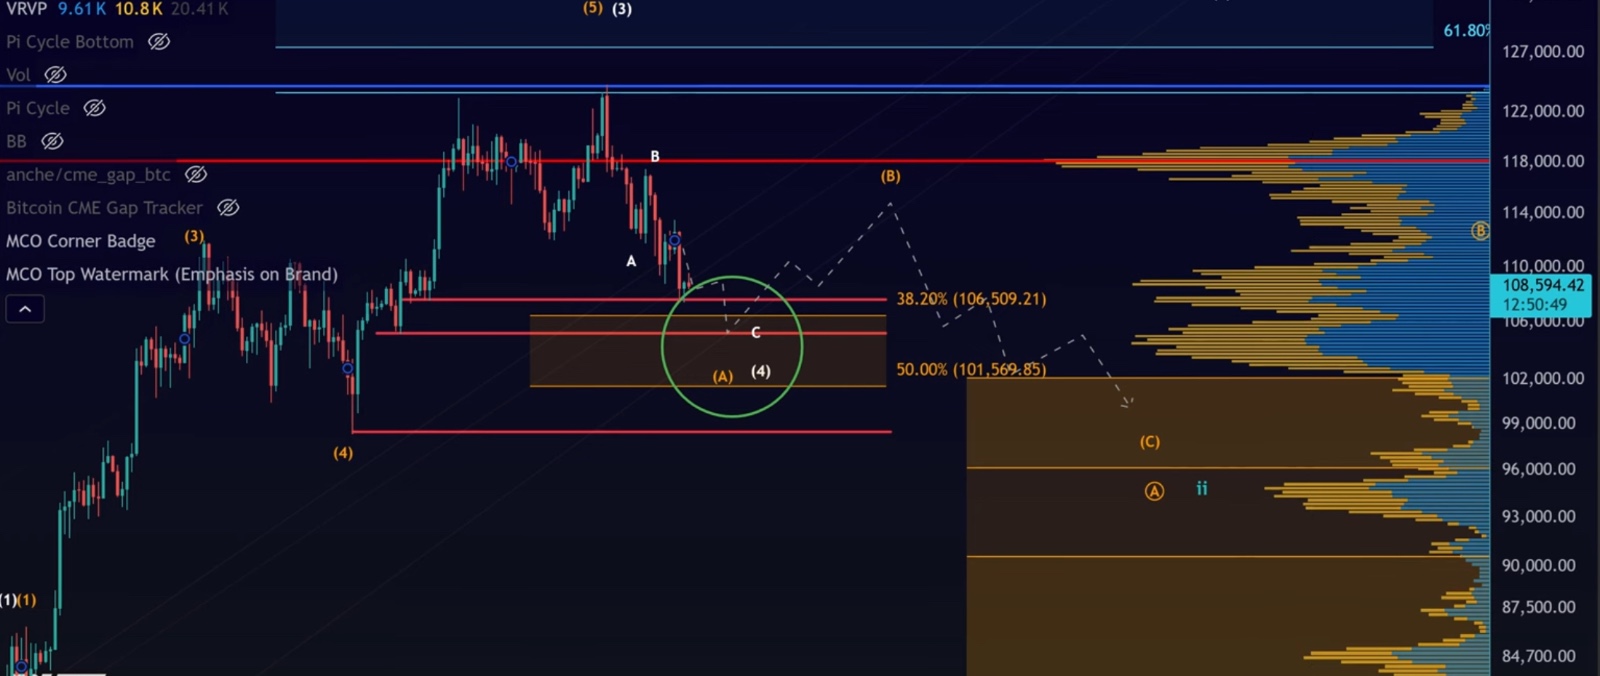
Looking at the daily chart, Bitcoin continues to trade around the $105,000 zone—highlighted earlier as a critical level (green circle on the chart). Yesterday, we saw a small bounce from the structural support range between $107,000–$107,500.
This support isn’t a single line but more of a zone, and so far, Bitcoin is holding above prior swing lows. This tells us the market might consolidate within this area, similar to the range we saw between May and July. Such sideways price action could easily form part of a B-wave correction.
Short-Term vs. Larger Structure
On the daily timeframe, I’m tracking this move as an ABC corrective structure. There is no evidence yet that the correction is over, despite the small bounce we’ve observed.
Key support levels to watch:
•$106,510
•$101,734
•$101,569
There’s also a confluence zone around $101,600–$102,000, which combines several Fibonacci retracement levels and historical support.
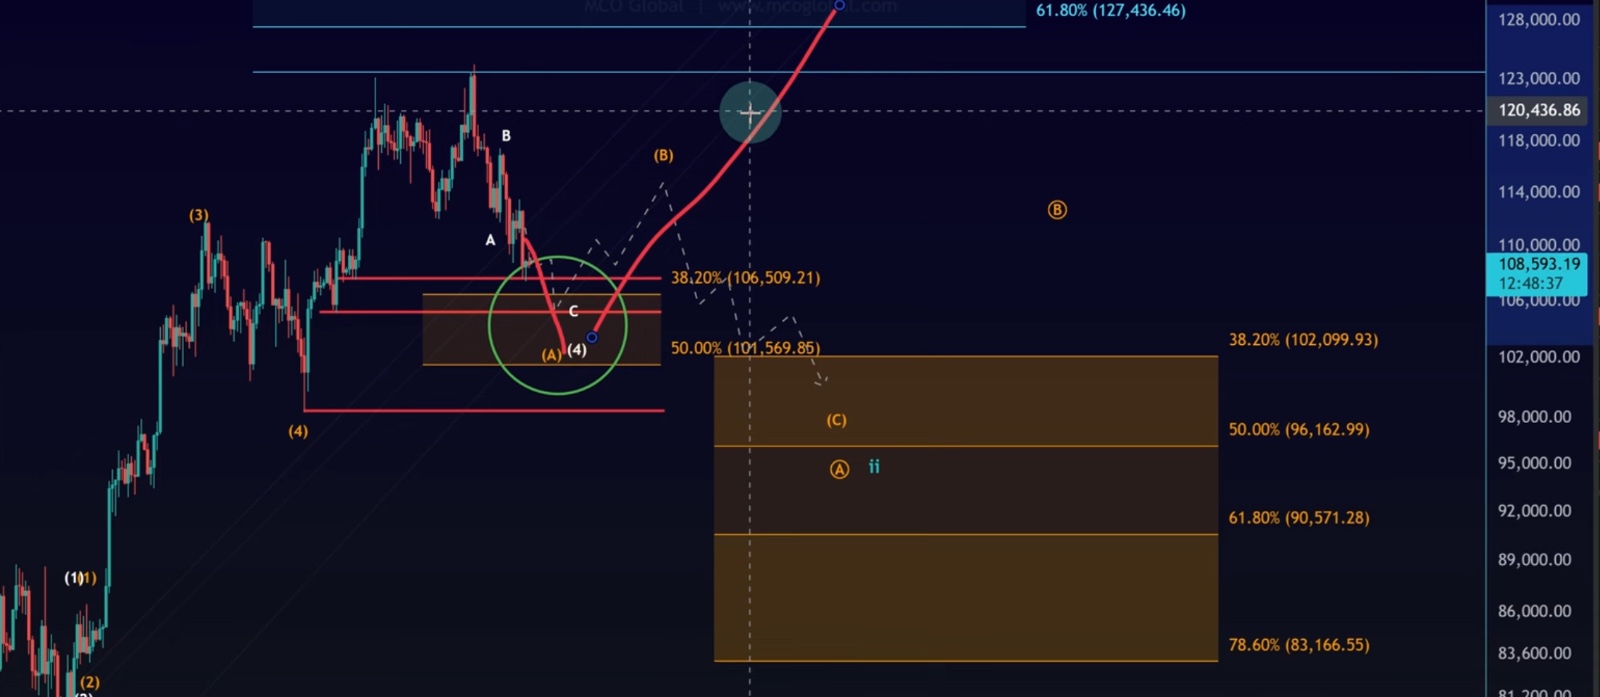
As long as $101,560 holds, the door remains open for one more high in this corrective wave. However, recent price action has slightly reduced probabilities for that bullish scenario, increasing the risk of a deeper correction.
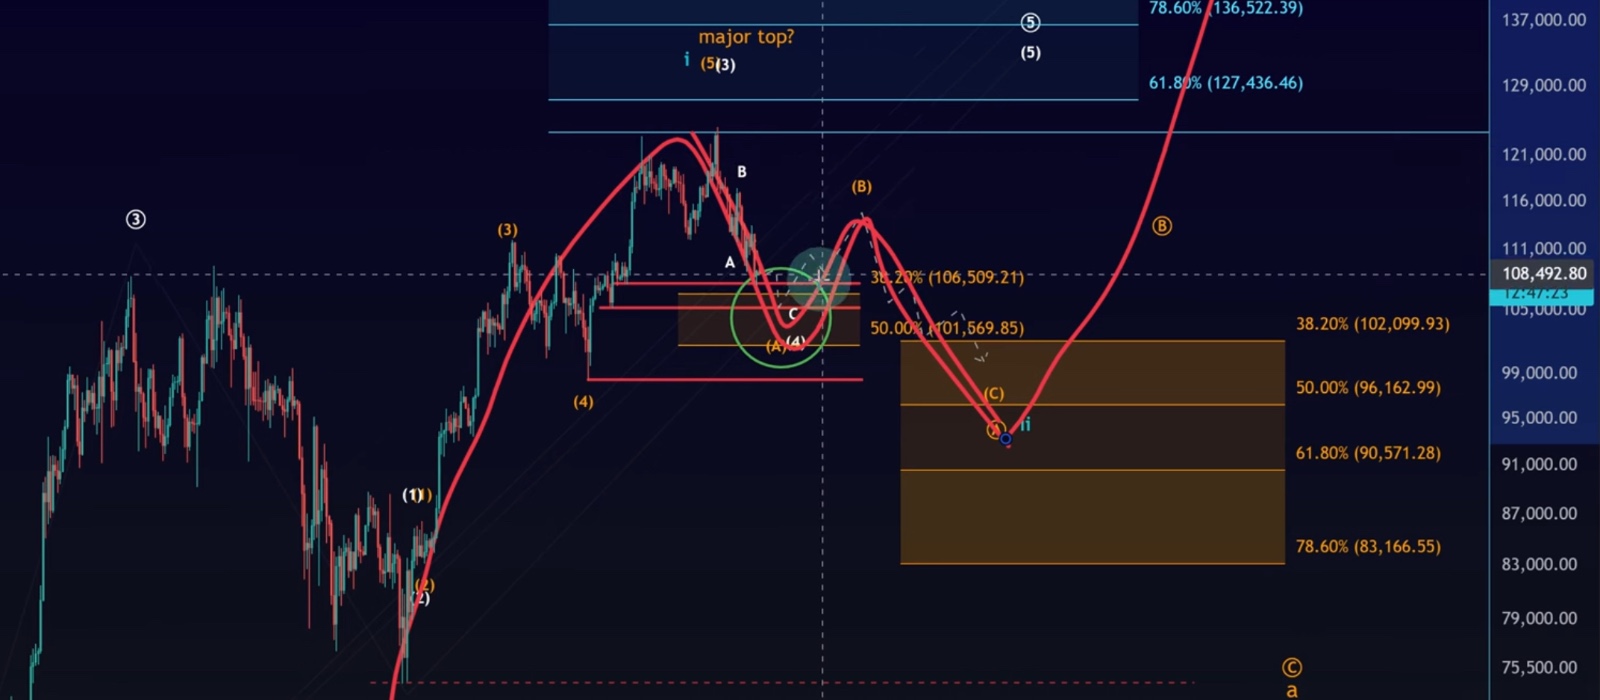
Even if we do break lower, this doesn’t necessarily spell disaster. A deeper pullback could set up a larger Wave 2 structure—potentially paving the way for a major bullish run to $150,000+ in the next impulsive wave.
Shorter Timeframe Insights
On the 1-hour chart, we anticipated a bounce because the market was oversold after a sharp drop. That bounce has materialized but remains weak and corrective in nature—choppy and messy to the upside rather than impulsive.
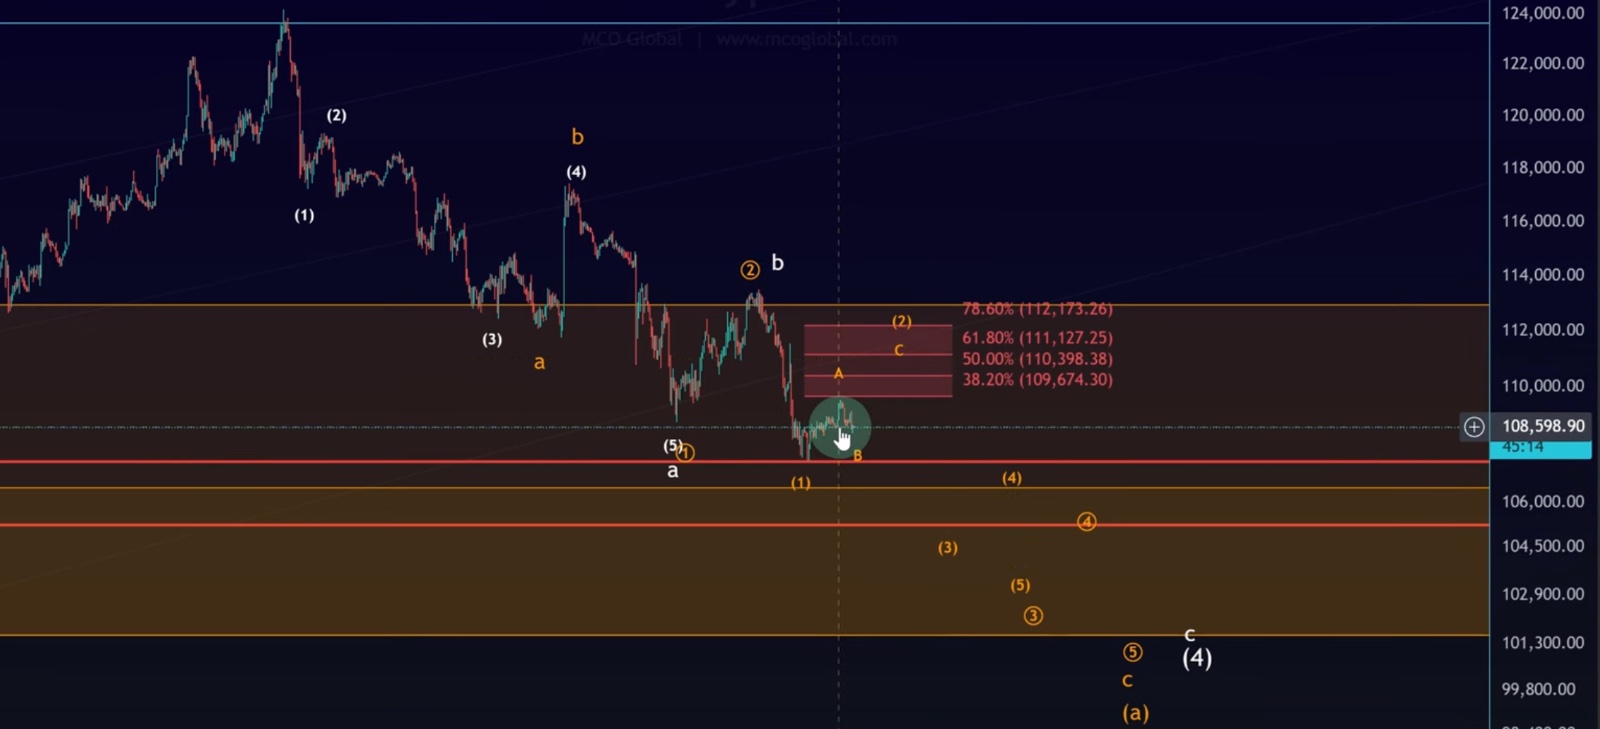
The first resistance zone to watch sits between:
•$109,674 – $112,173
So far, Bitcoin hasn’t even tested this zone, which means the current bounce remains unconvincing.
If Bitcoin fails to reach resistance and instead breaks down further, the $101,500 support will be at risk. A breakdown there would shift probabilities toward deeper downside scenarios, delaying any stronger bullish recovery.
Market Context – A Quiet Holiday Weekend
With the US stock market closed for Labor Day, trading volume and volatility have been muted. That explains why the bounce is weak and subdued.
When futures trading resumes, we may see more activity, but until then, Bitcoin is likely to remain in range-bound consolidation.
Key Takeaways
•$107K–$107.5K zone gave the first bounce, but momentum is weak.
•Critical support sits between $101,560 – $102,000.
•As long as that holds, a new high is still possible before correction deepens.
•Break below $101,500 opens the door to deeper downside.
•Near-term bounce looks corrective, not impulsive.
•Holiday trading likely keeps things quiet until markets reopen.
📌 Bottom line: Bitcoin is in the middle of a correction. The bounce is weak and corrective, but holding above $101,560 keeps the bullish pathway alive. Traders should watch the $109K–$112K resistance zone and the $101.5K support zone very closely for the next decisive move.