
Bitcoin continues to move through its latest correction, and as of now, there is no clear evidence that this pullback which began around August 14, 2025 has ended. While the market has shown signs of short-term bounces, the overall structure remains corrective, suggesting that the correction is still unfolding.
Correction Still in Play
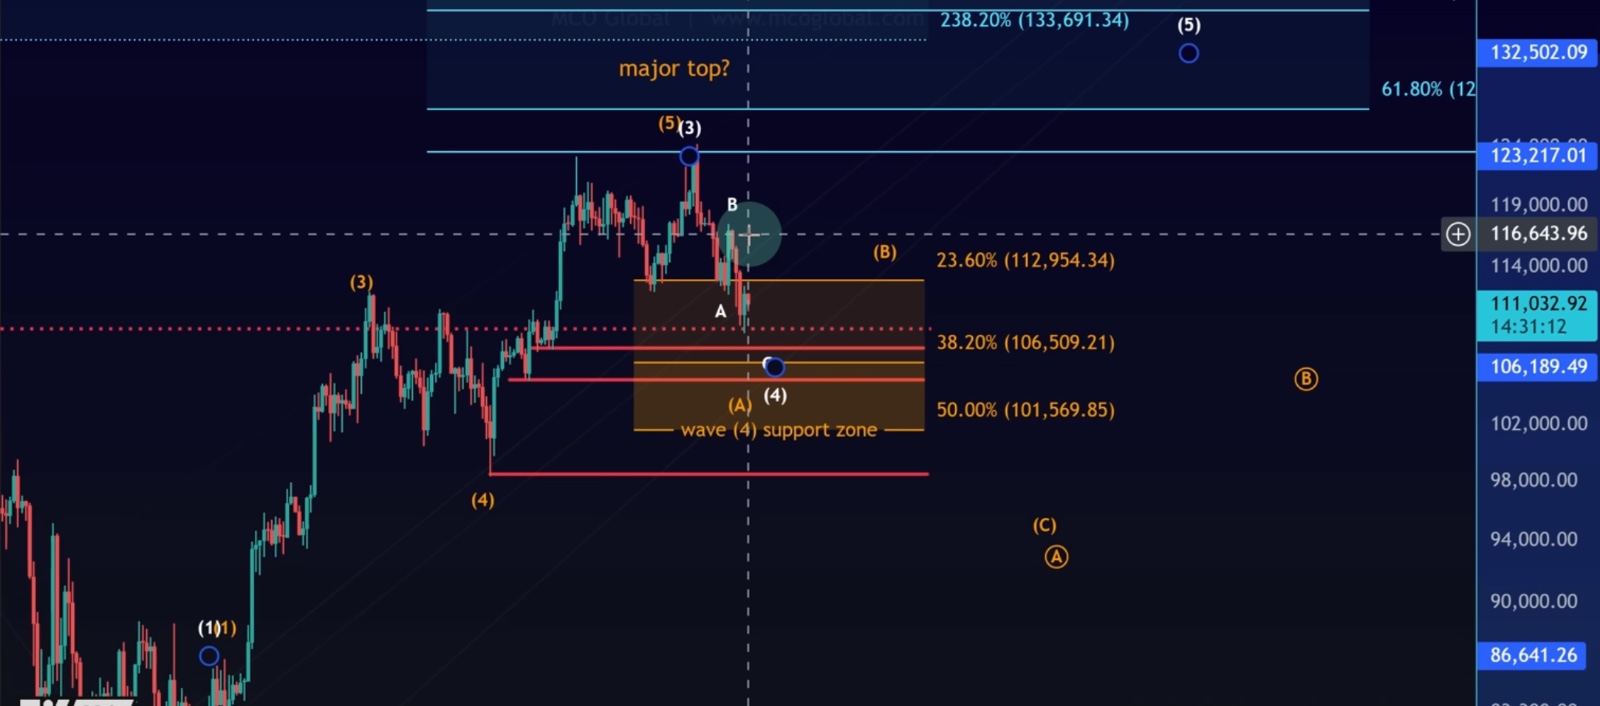
At this stage, Bitcoin does not yet have a clean bottom formation. The current market action shows a five-wave move down, but the bounce that followed looks corrective rather than impulsive. This lack of strength indicates that the low is not yet confirmed.
Importantly, this correction does not signal the end of the broader bull market. Bitcoin recently reached a new all-time high, and corrections after such highs are natural within Elliott Wave cycles. As long as price holds above key support levels, the broader uptrend scenario remains valid.
Key Support and Resistance Levels
• Major Support Zone: $101,569 (the lowest support level that should ideally hold for this to remain a Wave 4 corrective pullback).
• Current Support: Bitcoin is holding above the January 2025 swing high, also referred to as the “Trump’s inauguration speech swing high,” which acts as a critical technical level.
• Short-Term Support: $109,556 – $111,000 (micro support range).
• Resistance Zone for B-Wave Rally: $114,780 – $120,780.
If Bitcoin can defend the support zone, bulls could still attempt a fifth wave rally. However, for now, the bounce remains corrective and not a clear reversal.
Two Elliott Wave Scenarios
Currently, there are two possible interpretations of this corrective phase:
1. White Scenario – Larger ABC Structure
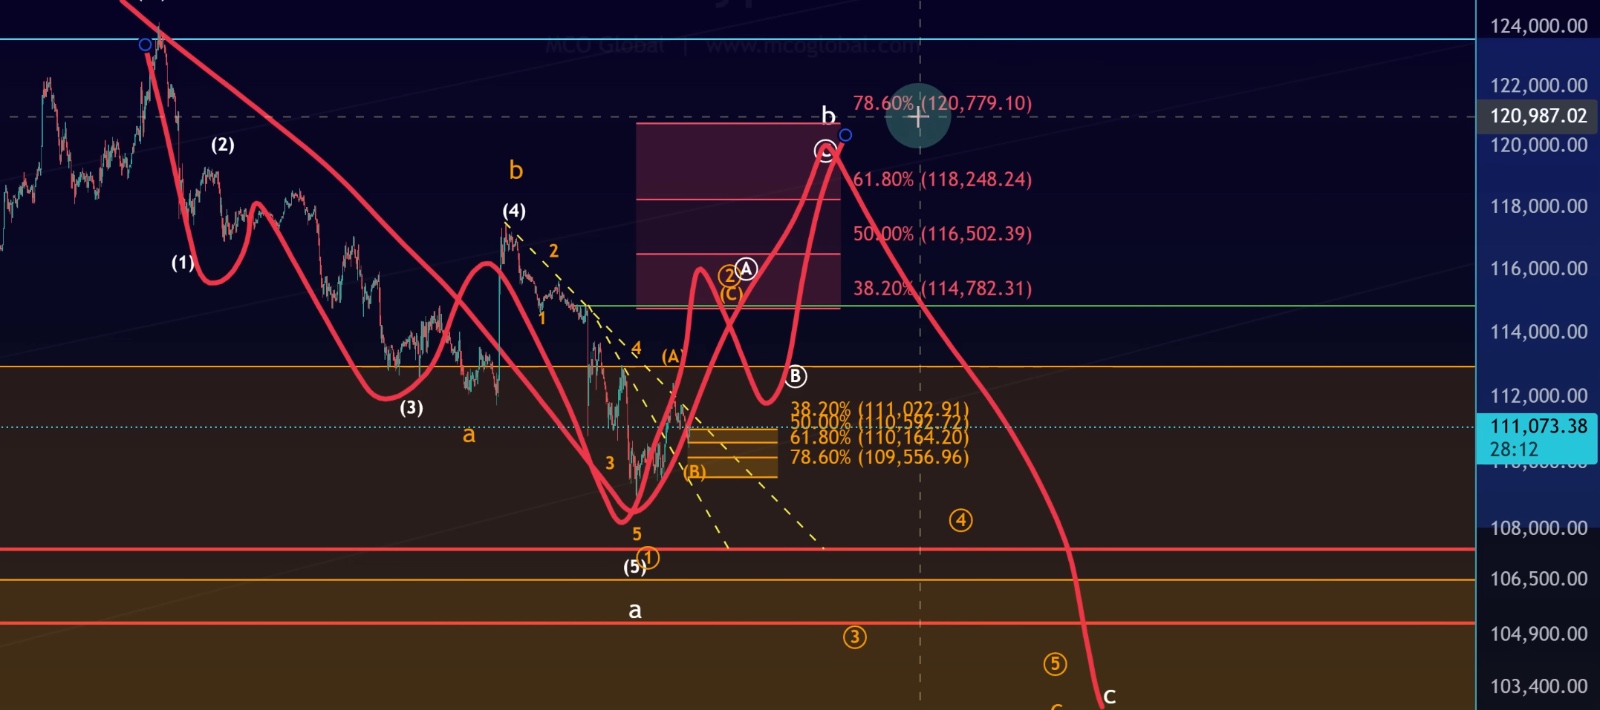
• Wave A: Five-wave decline completed.
• Wave B: Market currently in a corrective B-wave rally, targeting resistance between $114,780 and $120,780.
• Wave C: Expected to follow, bringing another leg down after the B-wave is complete.
B-waves are historically difficult to track because they take many forms, but the overall movement so far fits this structure.
2. Direct Move to Complete C-Wave
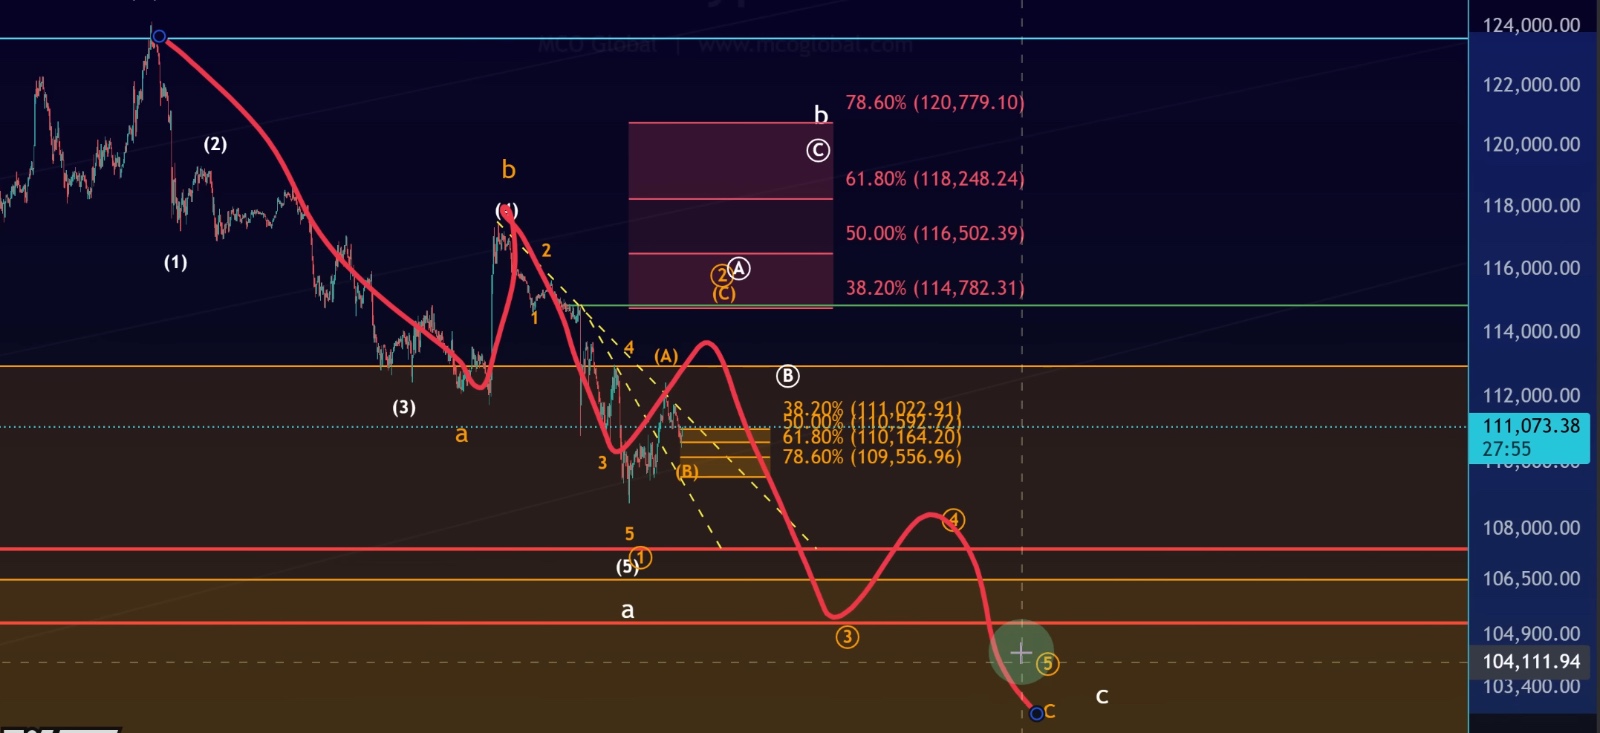
• On August 22, we may have already seen the B-wave completed.
• The market could now be heading directly lower in a five-wave C-wave decline.
Both counts currently lean bearish in the medium term, with the bounce being corrective in nature.
Short-Term Outlook
In the short term, Bitcoin remains within micro support between $109,556 and $111,000. As long as this range holds, there could be one more push higher towards $114,000 – $115,000.
However, it’s important to note:
• This move would likely remain corrective, fitting into a Wave 2 rally.
• A rejection from the upper trendline has already been seen, which reinforces caution.
• Only a clear breakout above resistance would shift the short-term outlook to a stronger bullish bounce.
Conclusion
Bitcoin’s Elliott Wave structure suggests that the correction from mid-August is not yet complete. While short-term bounces are possible, the overall move remains corrective, keeping the risk of further downside intact.
• Holding $101,569 support is crucial for maintaining the broader bullish trend.
• Short-term upside targets are $114,000 – $115,000, but unless confirmed by a breakout, these are likely corrective bounces.
• Resistance between $114,780 – $120,780 will be key to watch before the market defines its next major move.
For now, traders should recognize that the larger correction is still unfolding, and Bitcoin’s bullish fifth wave attempt will only be validated if critical supports hold and the market breaks above corrective resistance.