
Bitcoin has now reached a critical resistance zone on the daily chart, touching the 61.8% Fibonacci retracement level at $117,450. This development aligns closely with expectations and confirms that the market has entered the anticipated decision zone.
🔍 Daily Chart Overview
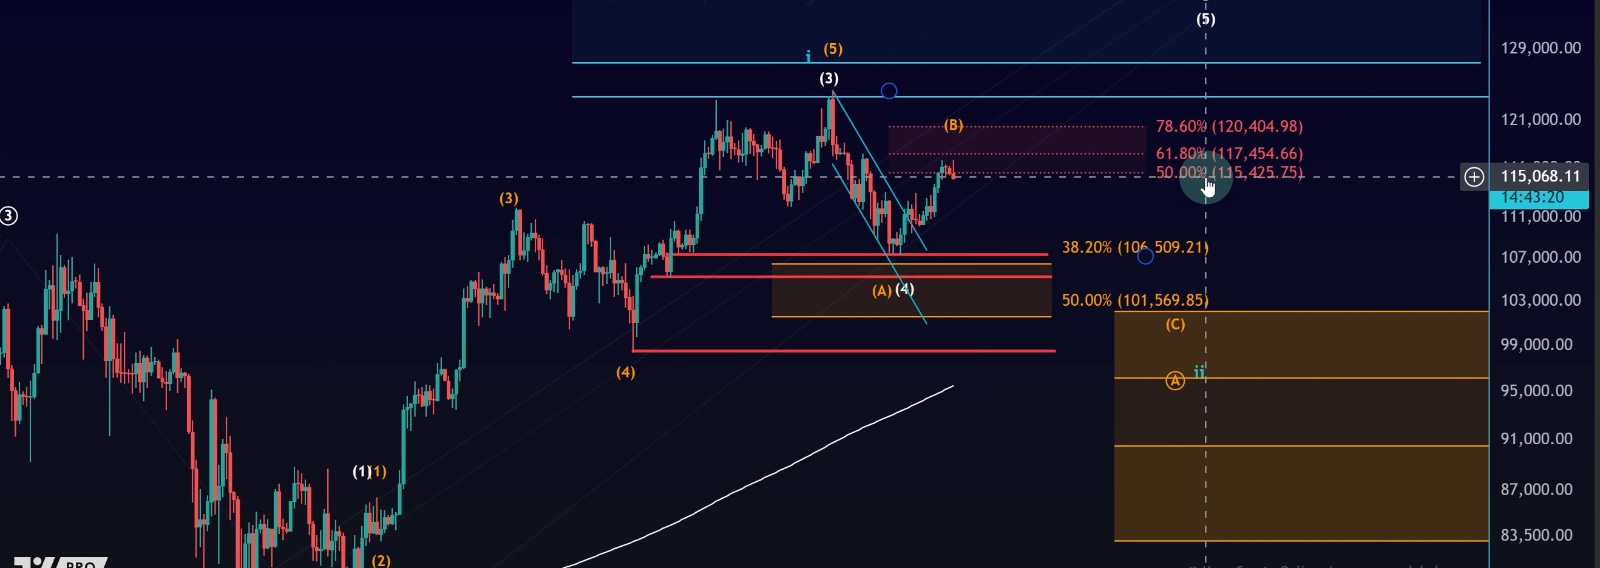
We continue to track two key Elliott Wave scenarios:
•Orange Scenario: A potential B-wave in play, with room for one more push higher.
•White Scenario: An alternative count that also projected a move into this resistance area.
Both scenarios highlighted this zone as a likely turning point, backed by:
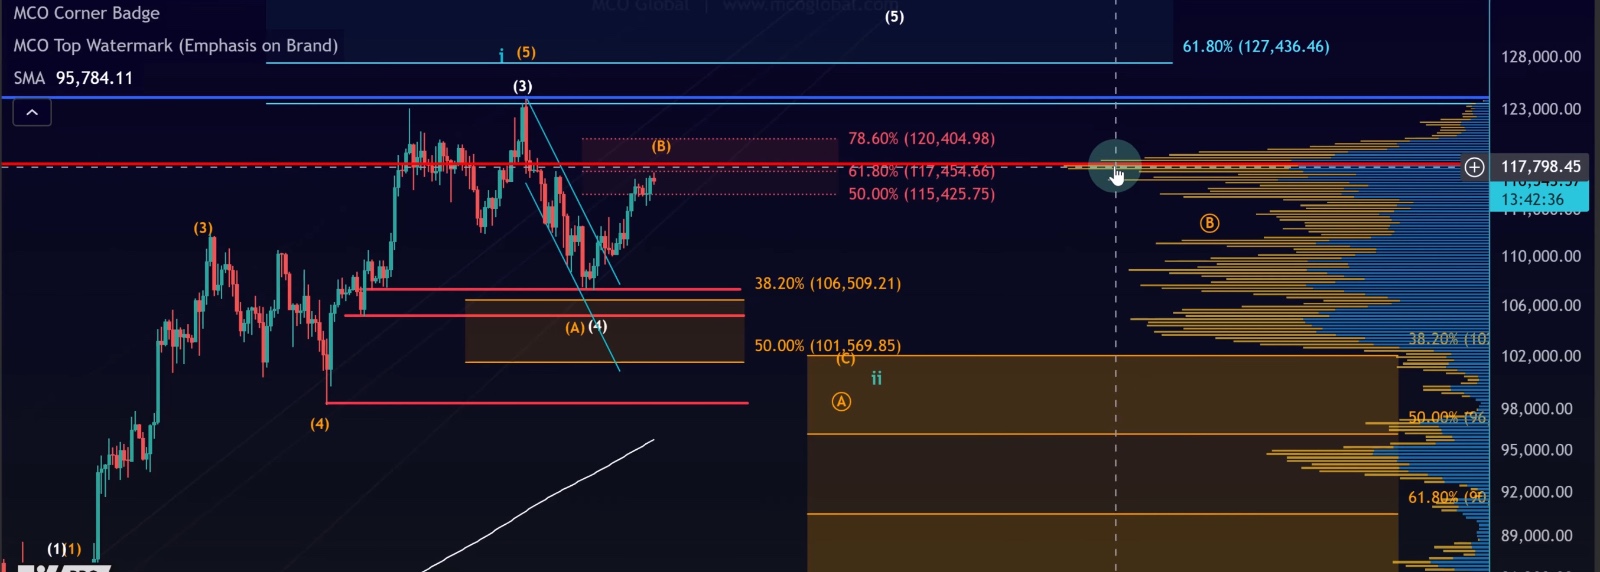
•The VRVP (Volume Profile) showing a strong point of control acting as a magnet.
•Resistance confluence reinforced by liquidation heat maps indicating heavy volatility.
At this stage, the market is exactly where we expected it to be — but this is also where risks rise.
📊 Current Market Dynamics
•Bitcoin is at high risk of rejection in this resistance zone.
•There is no confirmed signal yet that the B-wave has topped.
•The uptrend remains intact for now, but the more mature the B-wave structure becomes, the greater the risk that bears take over.
From a trading perspective:
•Not a great long setup → reward-to-risk ratio is poor at this stage.
•Not a short setup yet either → we need to see a proper 1–2 structure down before shorts become viable.
•Best approach → observe and wait for confirmation.
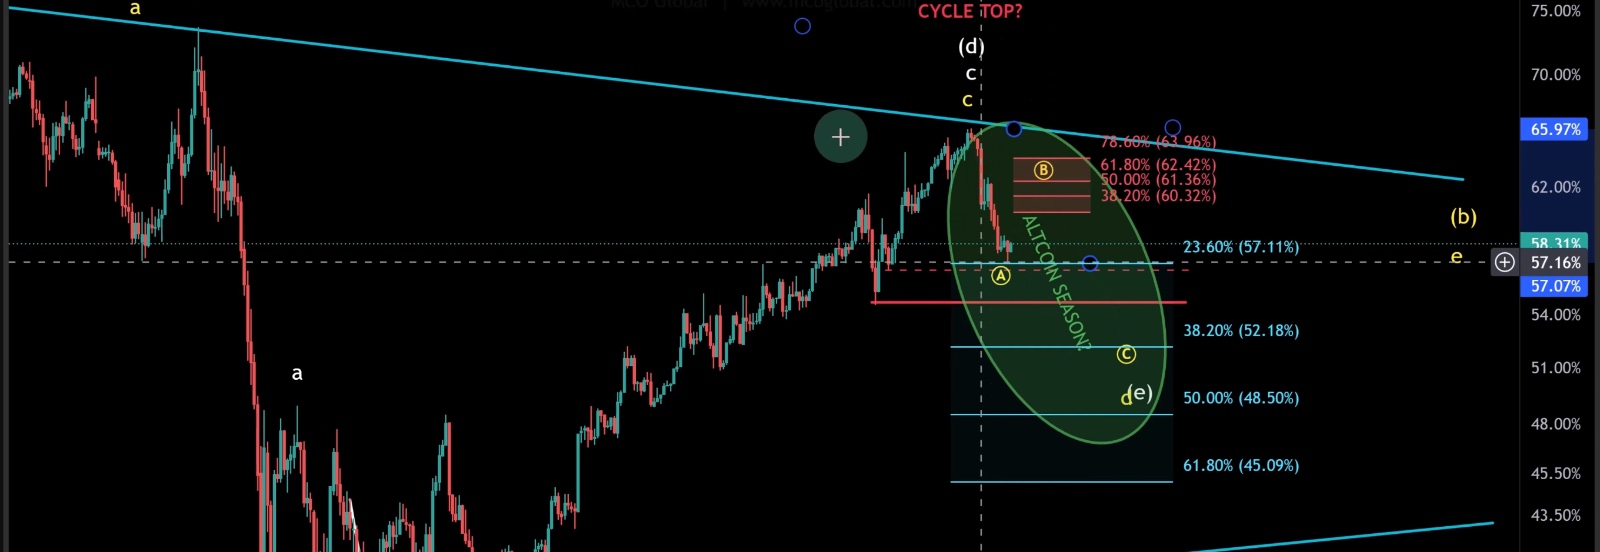
📈 Bitcoin Dominance & Altcoins
Some traders have raised questions about conflicting signals between Bitcoin resistance and bullish altcoin structures. Here’s how it fits together:
•Bitcoin Dominance: Historically, October often brings a bounce in dominance. We may be seeing the early signs, though Elliott Wave counts on dominance are unreliable because it’s not a tradable asset.
•Altcoins: Even if Bitcoin dominance rises, altcoins can still move higher (though usually with less strength).
•Key point: Focus on individual setups. Altcoin structures, especially meme coins, are more fragile, but if the setup is valid, it stands regardless of Bitcoin’s resistance zone.
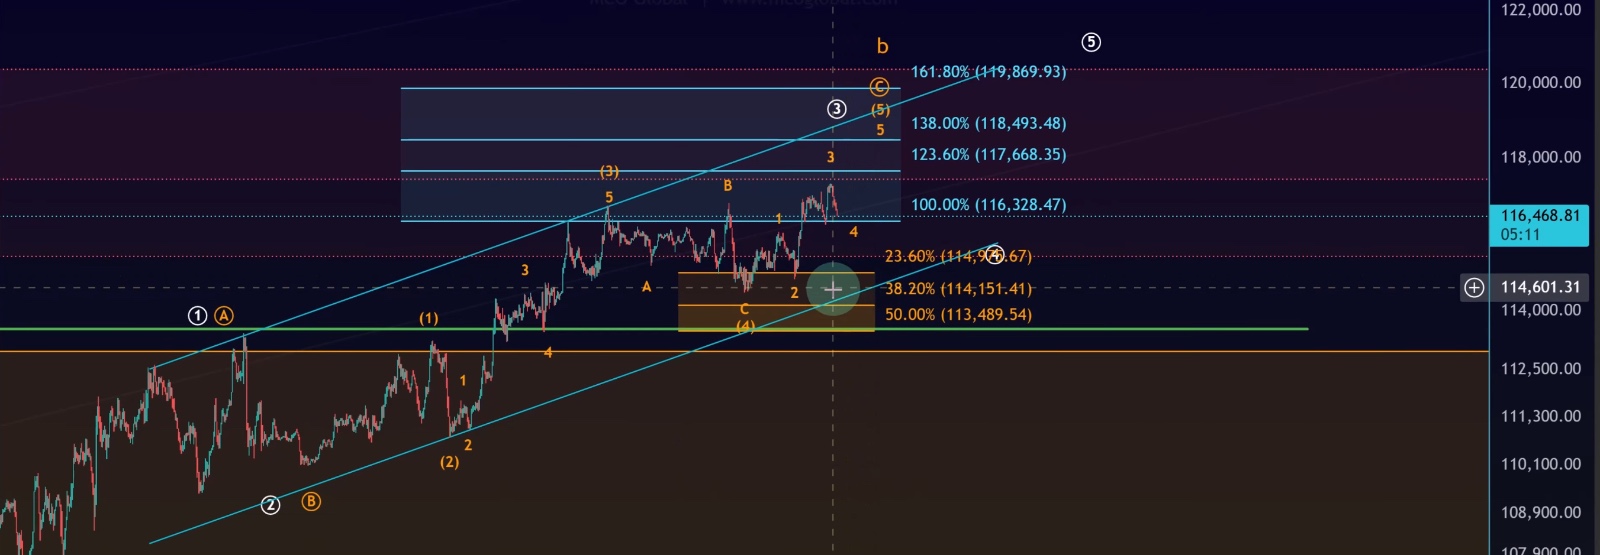
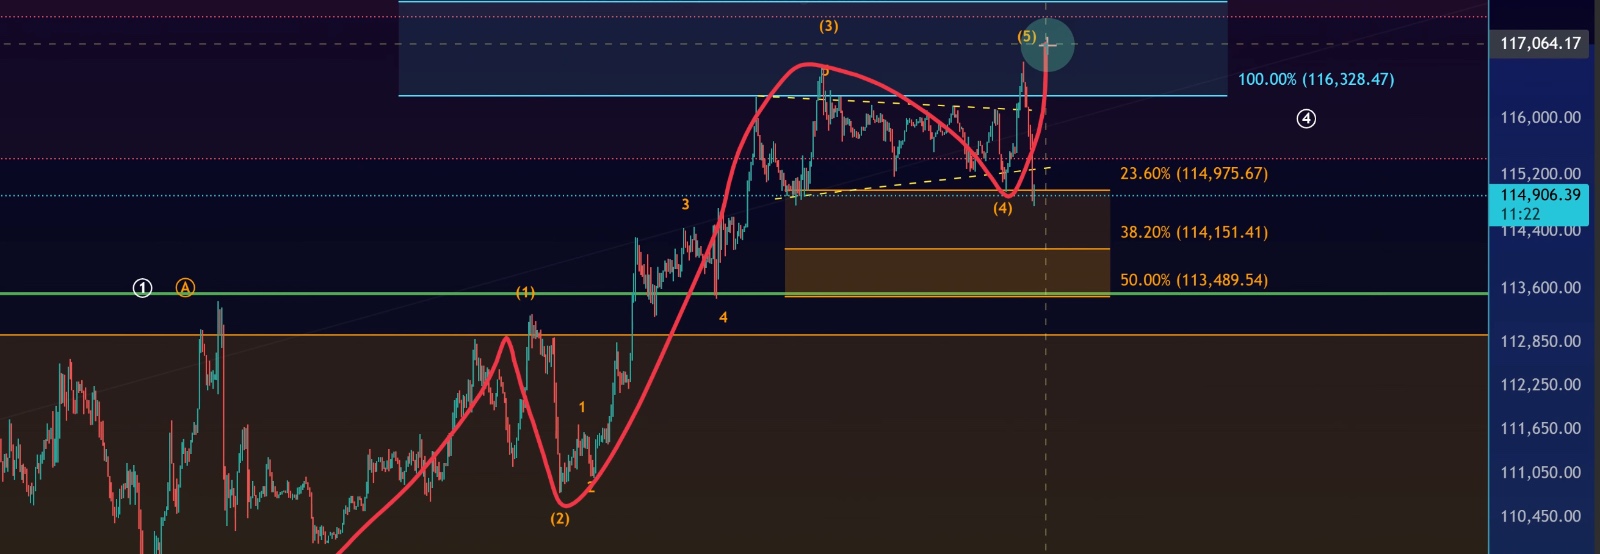
⏳ Short-Term Levels to Watch
On the lower time frames, Bitcoin is still moving inside a trend channel. Key levels:
•$114,500: Lower boundary of the channel.
•$114,800: Previous swing low.
•$113,490: Critical support (green line).
Signals of a Local Top
•A break below $114,500 and $114,800 would signal weakness.
•A decisive break of $113,490 + five-wave decline would confirm that a local top (orange B-wave) is in place.
Upside Potential
•As long as support holds, Bitcoin can still push higher.
•A move to $118,500 remains possible and could even mark a viable third wave extension.
📌 Conclusion
•Bitcoin has reached $117,450 (61.8% Fib retracement) — a critical resistance level.
•This is the decision zone, where the risk of rejection is high.
•No confirmed top yet → trend is still up until support breaks.
•Key downside signal: A five-wave move down below $113,490.
•Upside window remains open: A push toward $118,500 is still viable if support holds.
For now, this is a high-risk observation area. Best strategy: follow the trend, watch support and resistance closely, and wait for clear signals before taking action.