
Bitcoin has continued its recovery from the August lows, moving firmly into our resistance area that we’ve been tracking over the last couple of weeks. The price action is unfolding largely as expected, with both the macro resistance zone and the short-term target area now being tested. Let’s break it down across the daily and intraday charts.
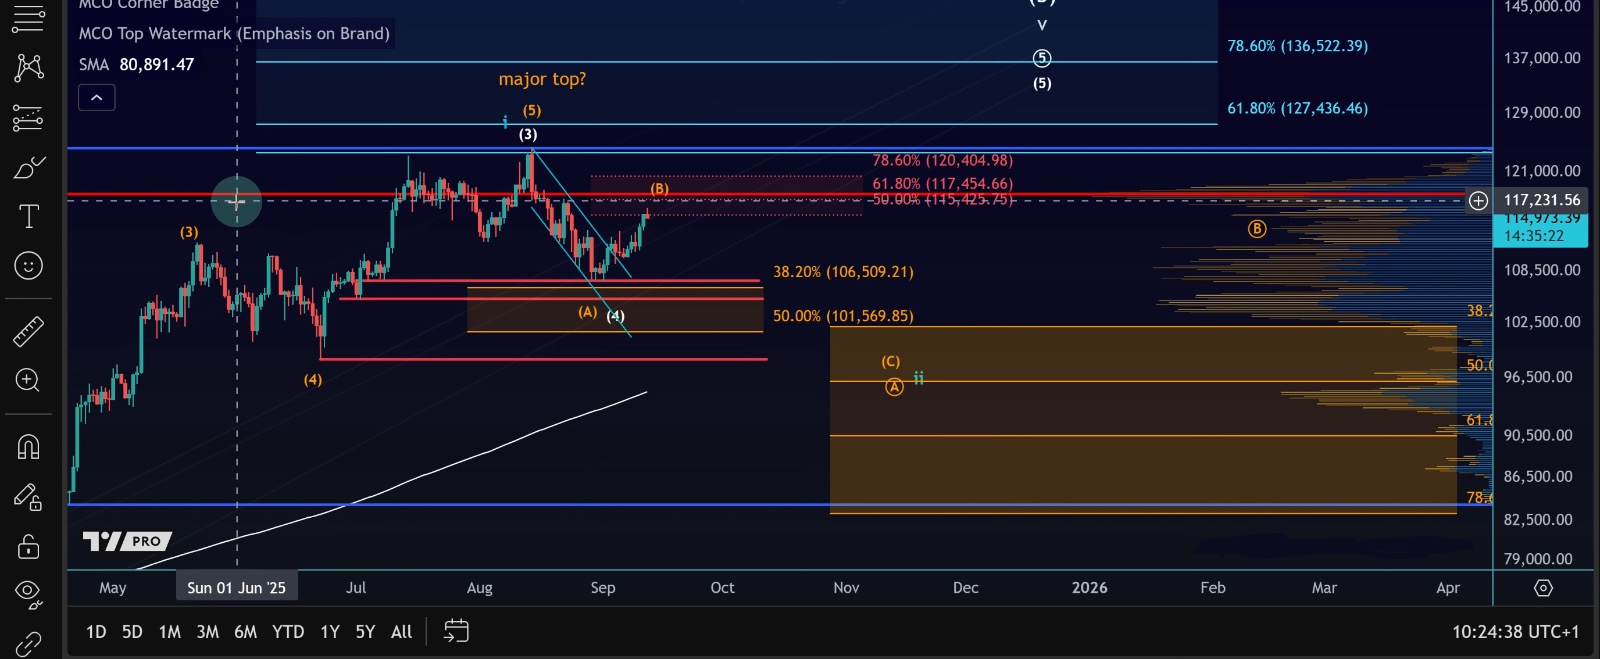
📊 Daily Chart – Resistance Zone in Focus
Since late August, we’ve been watching the $118K area as the next major resistance. This level lines up with several important technical factors:
•VRVP Point of Control around $118K → historically a strong area of price interest
•Fibonacci resistance → standard resistance for a potential B-wave
•Liquidation heatmaps → highlighting heavy activity between $118K and $120K
This makes the $118K–$120K range a key battleground. So far, price has only just arrived there, and we haven’t seen any strong reaction yet.
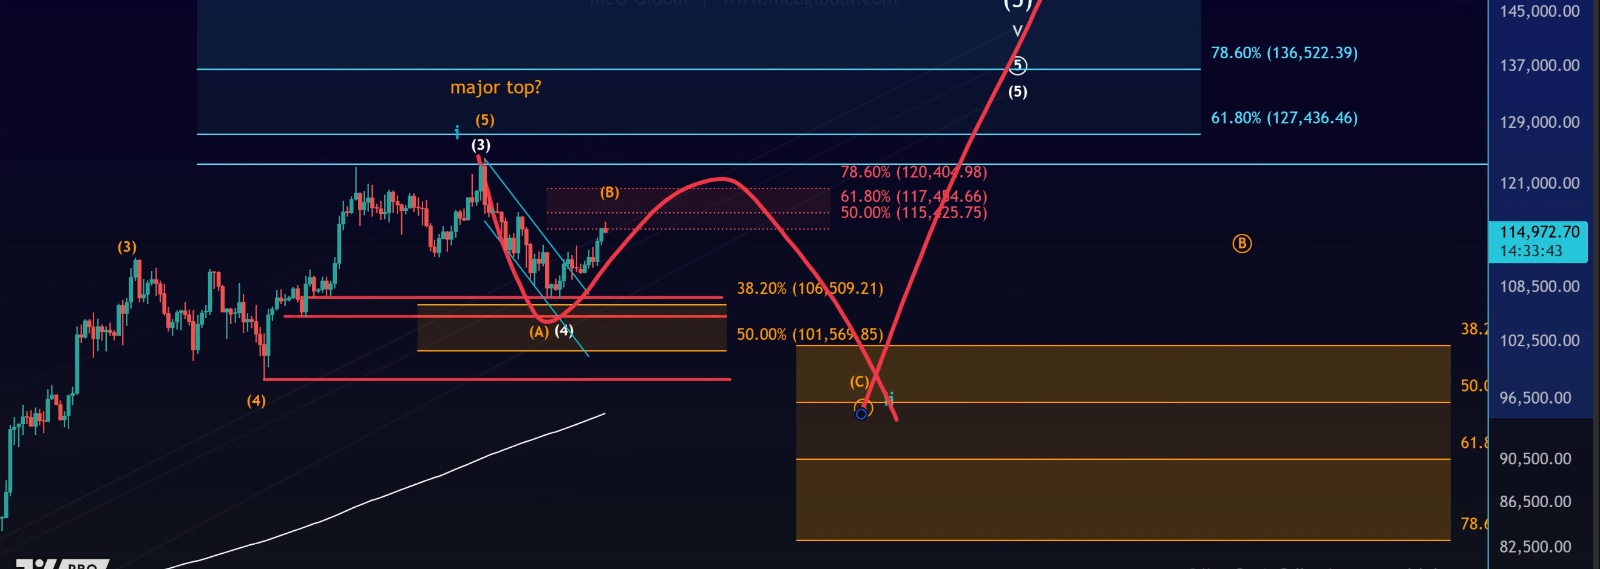
Two Main Scenarios Still Valid
•Wave A scenario (orange): Current move is part of a corrective B-wave rally → could still see one more high before topping.
•Wave 4 scenario (white): A larger wave structure still unfolding, which could eventually lead to new all-time highs.
Both remain possible, but the reaction at resistance will help us determine which path is playing out.
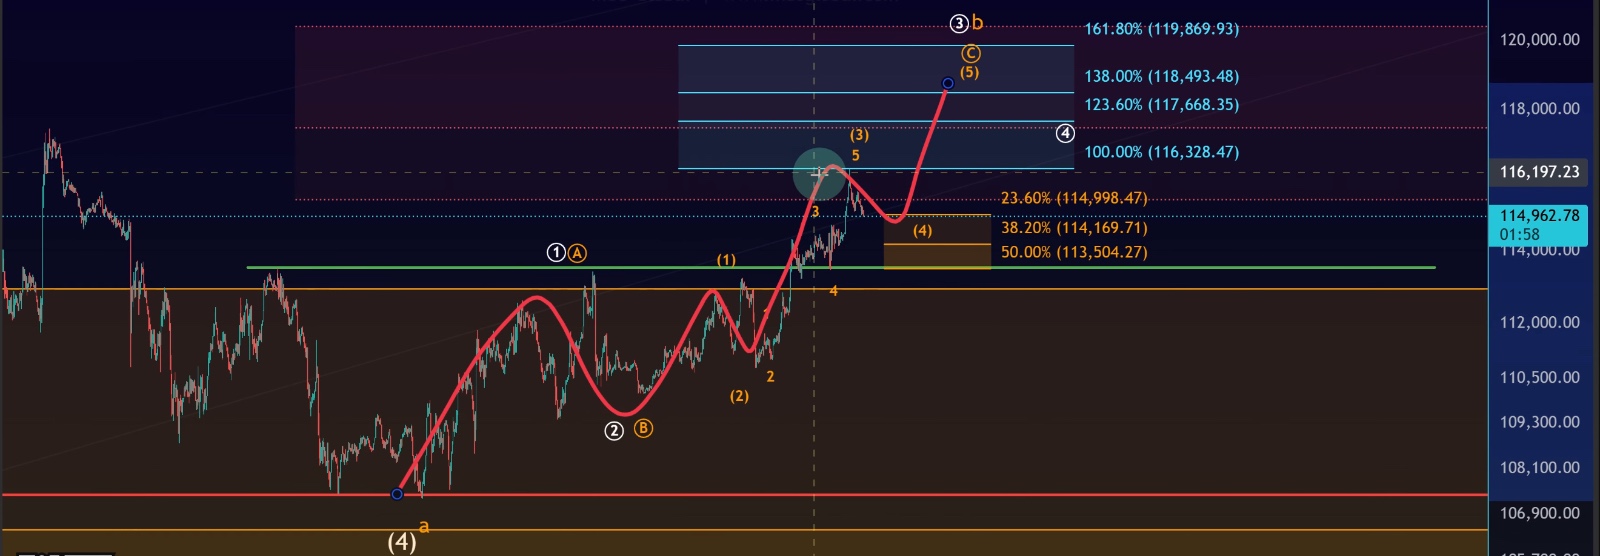
📈 Short-Term Chart – Target Hit, First Reaction Seen
On the 1-hour timeframe, Bitcoin has now reached the blue target zone we’ve been tracking for several days. This was the standard projection for the C-wave of the B-wave, based on Fibonacci extensions.
•Price hit the 100% extension → suggesting a potential short-term top is in.
•First small reaction has occurred → not big enough to show on the daily, but visible intraday.
•Nearest micro support lies between $113,500 and $115,000 → this is the Fibonacci support zone currently being tested.
Short-Term Outlook
•If Bitcoin holds this support and consolidates, we could still see one more push higher in this B-wave.
•The next resistance extensions sit at $117,670 and $118,500.
•Failure to hold above $113,500 could trigger a deeper correction, possibly forming a wave 4 retracement.
⚡ Key Takeaways
1.Bitcoin has reached the resistance zone ($118K–$120K) we’ve tracked for weeks.
2.The B-wave rally scenario is still unfolding, with one more high possible.
3.First reaction is visible at the 100% extension, suggesting a potential micro-top.
4.Micro support zone $113.5K–$115K is critical in the short term.
5.Upside targets remain at $117.7K and $118.5K, but only if support holds.
✅ Bottom line: Bitcoin has done what we expected—reaching the $118K resistance. Now the market’s reaction here will be crucial. If support holds, another high in this B-wave is possible before larger decisions unfold. If not, we may see a deeper correction start to take shape.