
Bitcoin’s price action today continues to reflect a mix of indecision and structure, with signs pointing to a possible triangle pattern on the nano structures. While this doesn’t change the bigger picture outlook, it provides a more refined explanation of the current movements. Let’s break it down across both the macro view and the short-term charts.
📊 Big Picture: Resistance Still in Focus
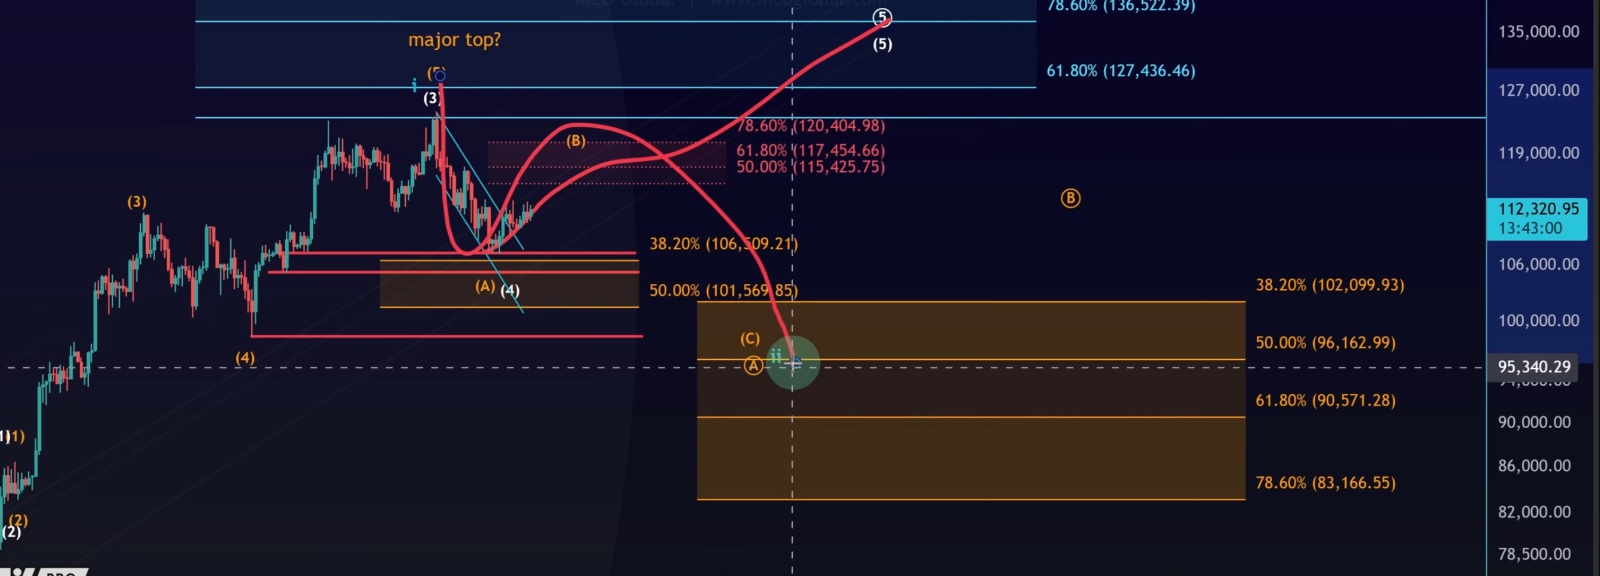
On the daily timeframe, Bitcoin remains in a local price range. The next key decision zone is situated between:
•$115,425 – $120,400
This area has repeatedly shown up across Fibonacci retracements, volume profiles, and liquidation heatmaps, making it the primary resistance to watch.
Two Bullish Pathways Still in Play
1.Direct move higher: A fifth wave from current levels, potentially targeting $130K+.
2.Broader ABC correction: A corrective Wave 2 that eventually leads to higher prices.
Both scenarios remain valid, but evidence is still lacking for a confirmed breakout.
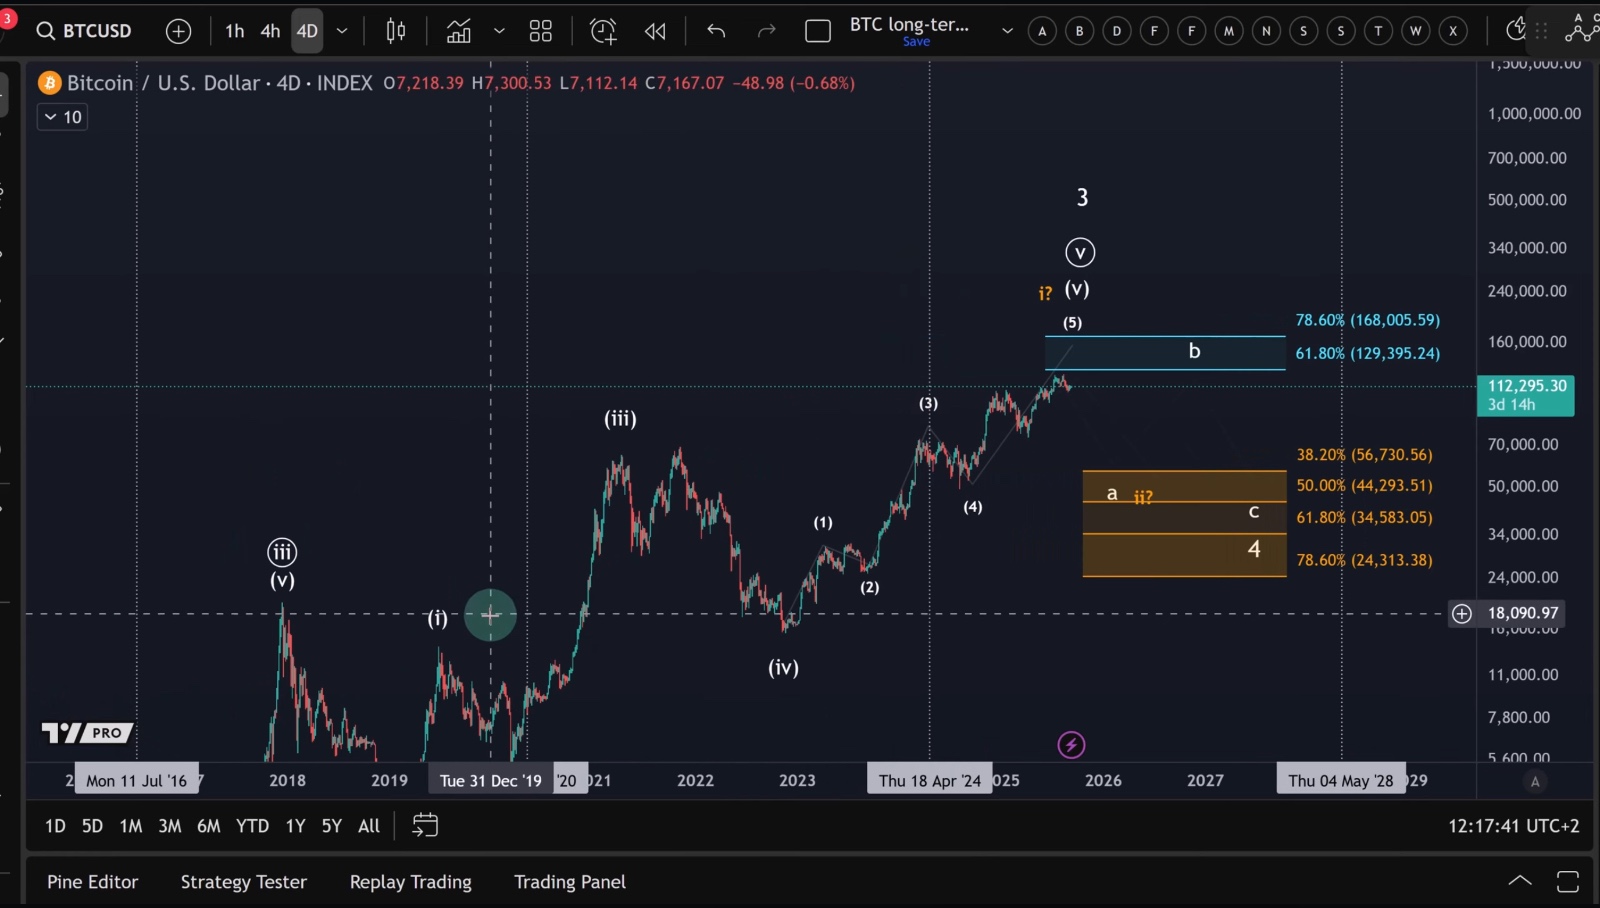
📈 Long-Term Risk – Nearing Cycle Completion
Looking at the 4-day logarithmic chart, Bitcoin may be nearing the completion of a major five-wave rally:
•From the 2018 low → 5 waves complete
•From the 2022 low → 5 waves possibly complete
•Zooming out to 2010 → multiple 5-wave cycles nearly finished
This suggests that macro risk has increased. While upside to $130K remains possible, a larger correction (bear market) could form at any point.
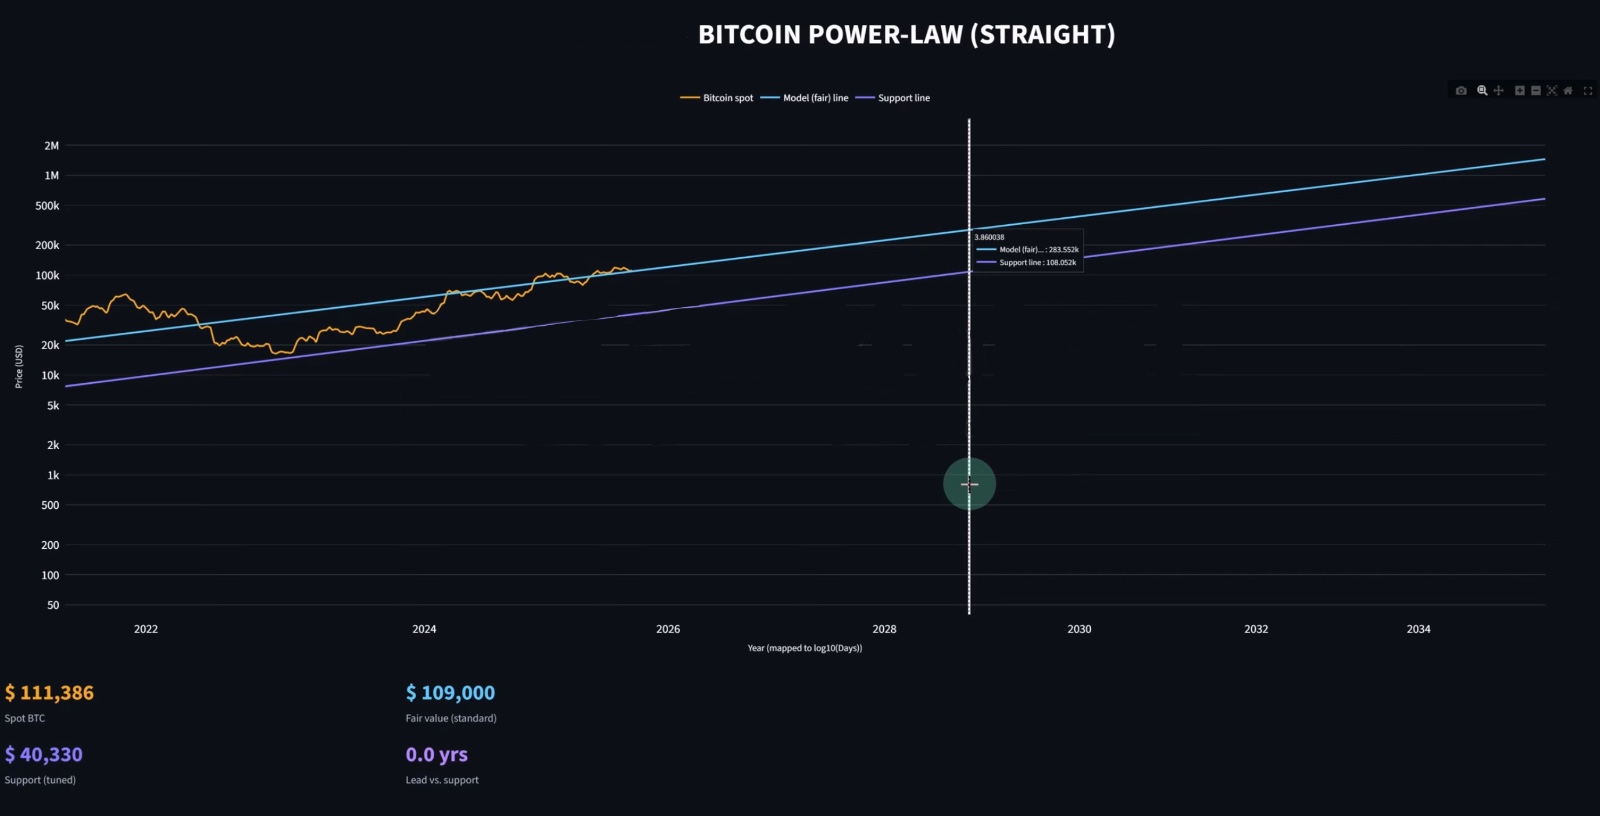
Macro Support Levels
•Standard Fibonacci support lies well below current levels
•The Power Law model currently shows a fair value near $109K and long-term support around $40K
•Historically, Bitcoin has never broken below the power law’s lower boundary, making it a critical line to watch in future bear markets
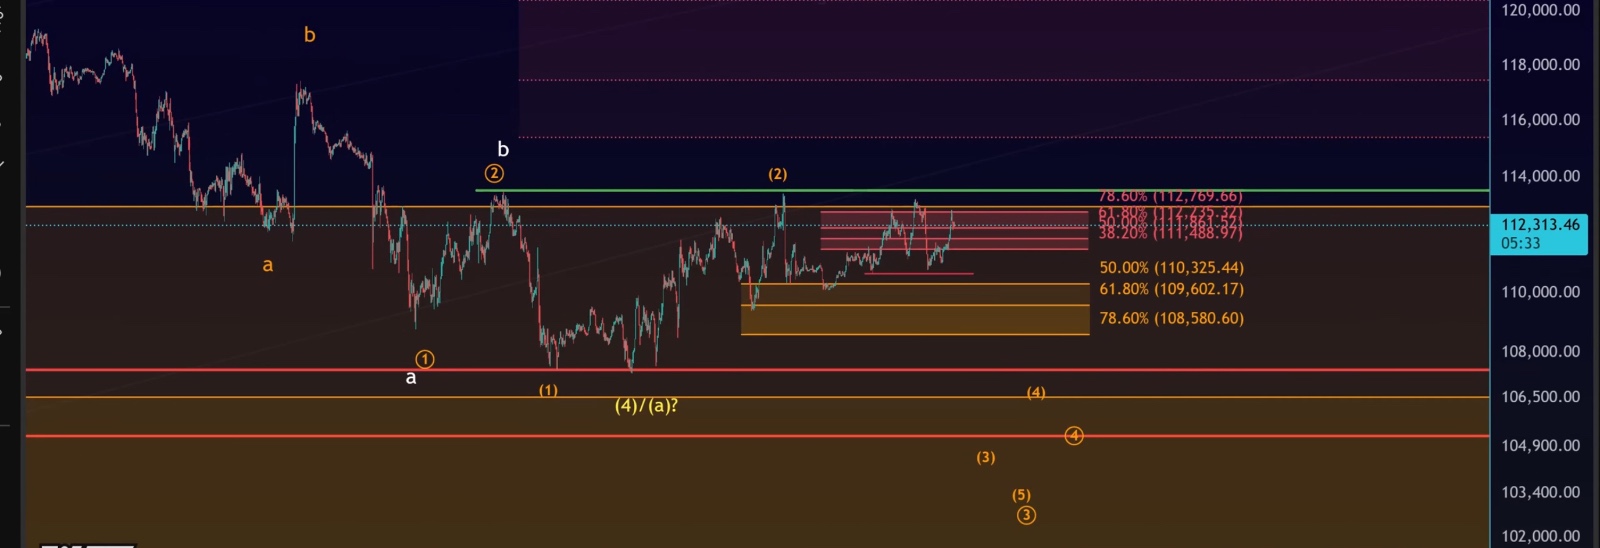
🔍 Short-Term Picture: Possible Triangle in Play
On the smaller timeframes, price action remains choppy, aligning with the idea of a triangle formation.
•The structure could be labeled A–B–C–D–E
•Triangles often appear in corrective contexts, which matches the broader B-wave bounce idea
•This suggests Bitcoin could grind higher into the $115K–$120K resistance zone before the next big decision
Key Levels to Watch
•Support: $108,580 – losing this level could trigger deeper downside
•Resistance confirmation: A breakout above $113,500 would strengthen the bullish case and suggest the triangle is resolving upward
⚡ Takeaways
1.Bitcoin is consolidating, potentially in a triangle pattern.
2.Macro risk is high – multiple long-term wave cycles appear nearly complete.
3.Upside scenarios remain, with $130K still a valid Elliott Wave target, but caution is warranted.
4.$115K–$120K remains the key resistance area to watch.
5.Short-term confirmation requires a breakout above $113,500; failure to hold $108,580 risks deeper downside.
✅ Bottom Line: Bitcoin continues to consolidate with choppy movements. The triangle formation provides a framework for short-term expectations, but the larger context warns of elevated risk as major wave cycles near completion. Patience and disciplined risk management remain critical.