
Today is Triple Witching Day in the stock market—a quarterly event where stock index futures, options, and single-stock options expire simultaneously. While this doesn’t directly impact crypto, it can indirectly increase volatility across risk assets, including Bitcoin. Let’s break down what’s happening on the Bitcoin chart across weekly and daily timeframes.
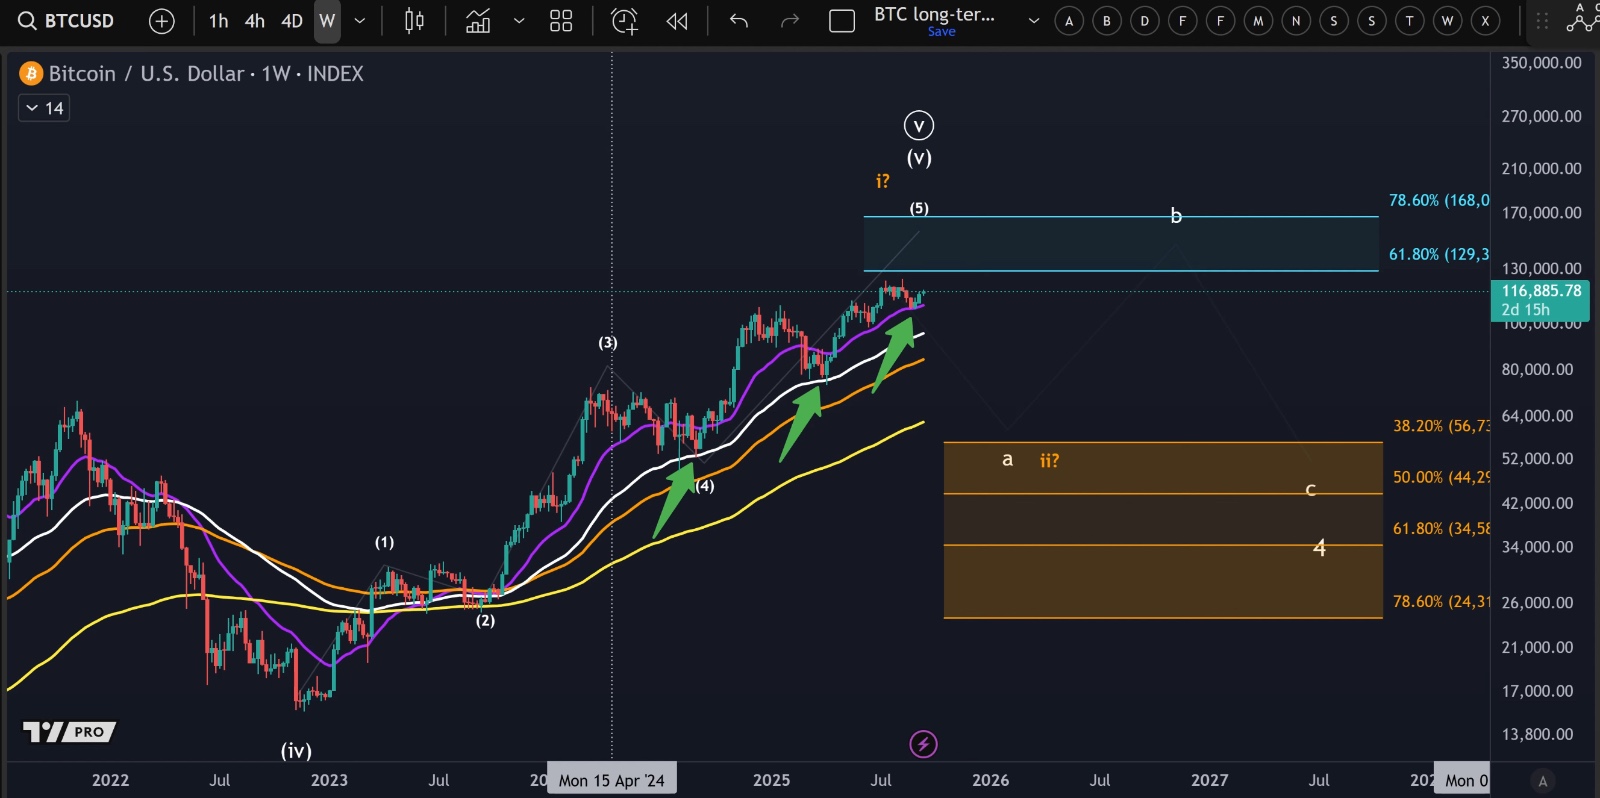
📊 Weekly Chart – Holding Above the 21-Week EMA
On the weekly chart, Bitcoin continues to hold above the 21-week exponential moving average (EMA), shown in purple. This level has provided reliable support during previous dips, such as in June and September.
•Current Trend: As long as Bitcoin stays above the 21-week EMA (~109K), the trend remains up.
•Key Support Below: The 55-week EMA (~96K) has been the most reliable support level throughout this bull market. It has acted as a trend-defining filter, holding firm during corrections in 2023 and 2024.
👉 If Bitcoin were to break below the 21-week EMA, it would not necessarily end the bull market, but testing the 55-week EMA would become likely. A decisive break below the 55-week EMA, however, would be problematic for the bulls.
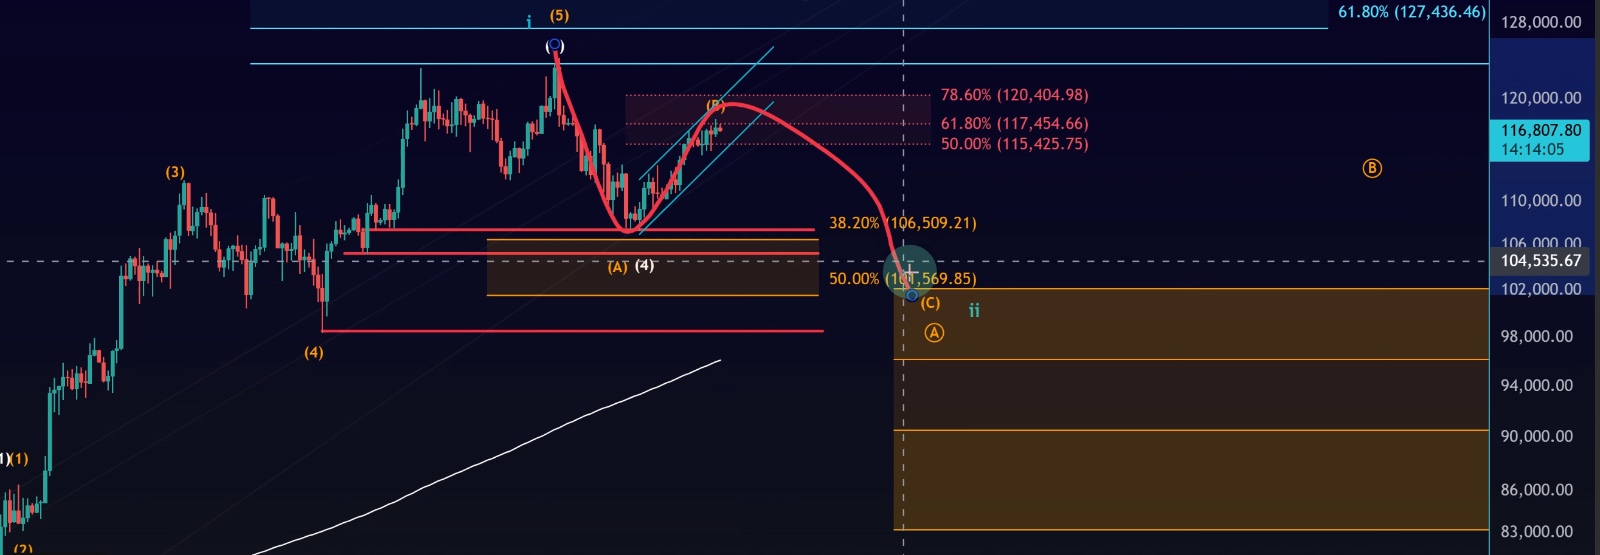
📈 Daily Chart – Grinding Through Resistance
On the daily timeframe, the story is all about resistance and the ongoing price channel.
•Bitcoin has now reached the red resistance zone we’ve been tracking for weeks.
•Price continues to grind upward within the blue trend channel, holding just below the 61.8% retracement level (117,450).
•Breaking above this level would be meaningful for the bulls.
Short-Term Action
•Bitcoin remains mid-range within its channel, consolidating after several attempts to push higher.
•The market hasn’t shown any signs of an impulsive sell-off—so far, it looks more like a controlled consolidation.
•We now have a potential five-wave structure complete on the daily chart, with Thursday’s push marking a possible wave five.
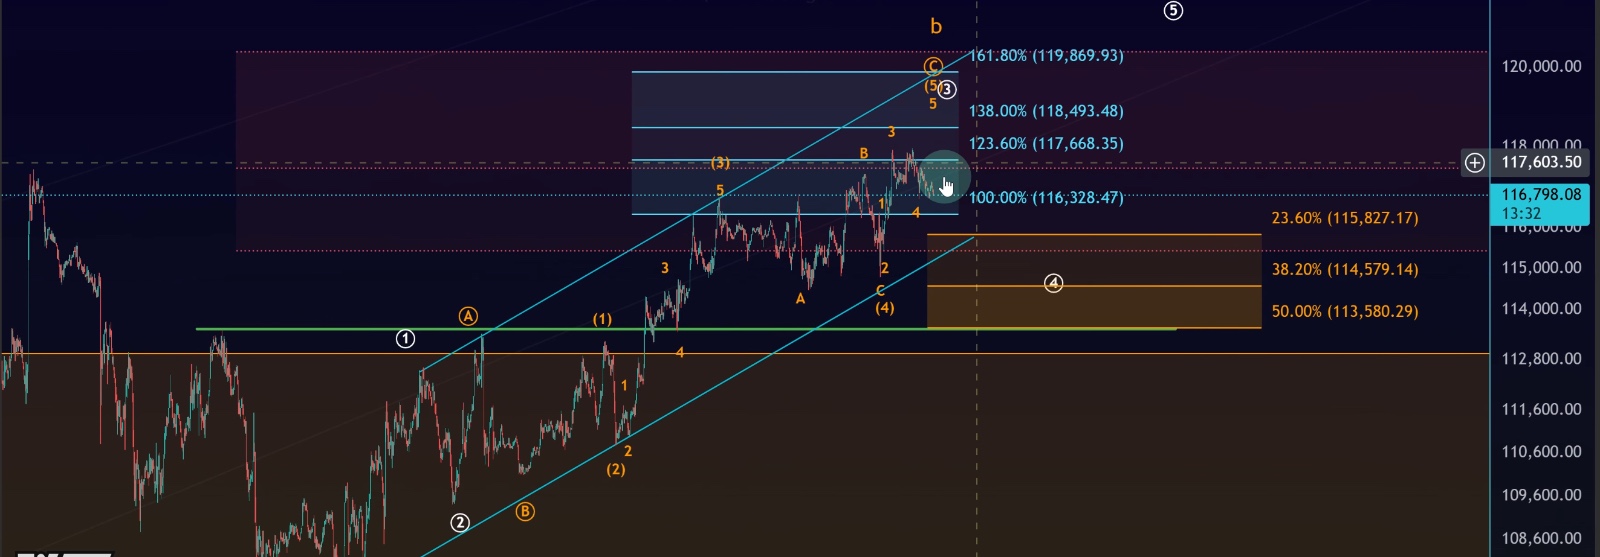
🔑 Key Support & Resistance Levels
•Resistance:
•61.8% Fib Retracement → 117,450
•123.6% Extension → Just above current levels (not yet broken)
•Support Zones:
•Lower boundary of the daily trend channel
•114,580 (Fib support)
•113,580 (Fib support)
👉 A break below 113,580 would be short-term problematic for bulls, potentially signaling the start of a larger C-wave correction.
✅ Conclusion
•Weekly Chart: The broader trend remains bullish as long as Bitcoin holds above the 21-week EMA (109K). The 55-week EMA (96K) remains the ultimate trend filter.
•Daily Chart: Price is consolidating within its channel just below major Fibonacci resistance. No impulsive sell-off yet, but rejection zones must be respected.
•Key Watch:
•Break above 117,450 → continuation higher.
•Break below 113,580 → short-term bearish pressure, possibly signaling a local top.
For now, Bitcoin is still grinding higher, supported by long-term moving averages, but the resistance area remains a decision zone. Traders should watch for either a breakout to the upside or confirmation of a local top through support breaks.