
Bitcoin continues to move deeper into its resistance area on the daily chart, testing the 61.8% Fibonacci retracement level but not yet breaking it decisively. This has been a key area we’ve been tracking for weeks, and the market has finally reached the 118K point of control from the volume profile indicator – a level that often acts like a magnet for price.
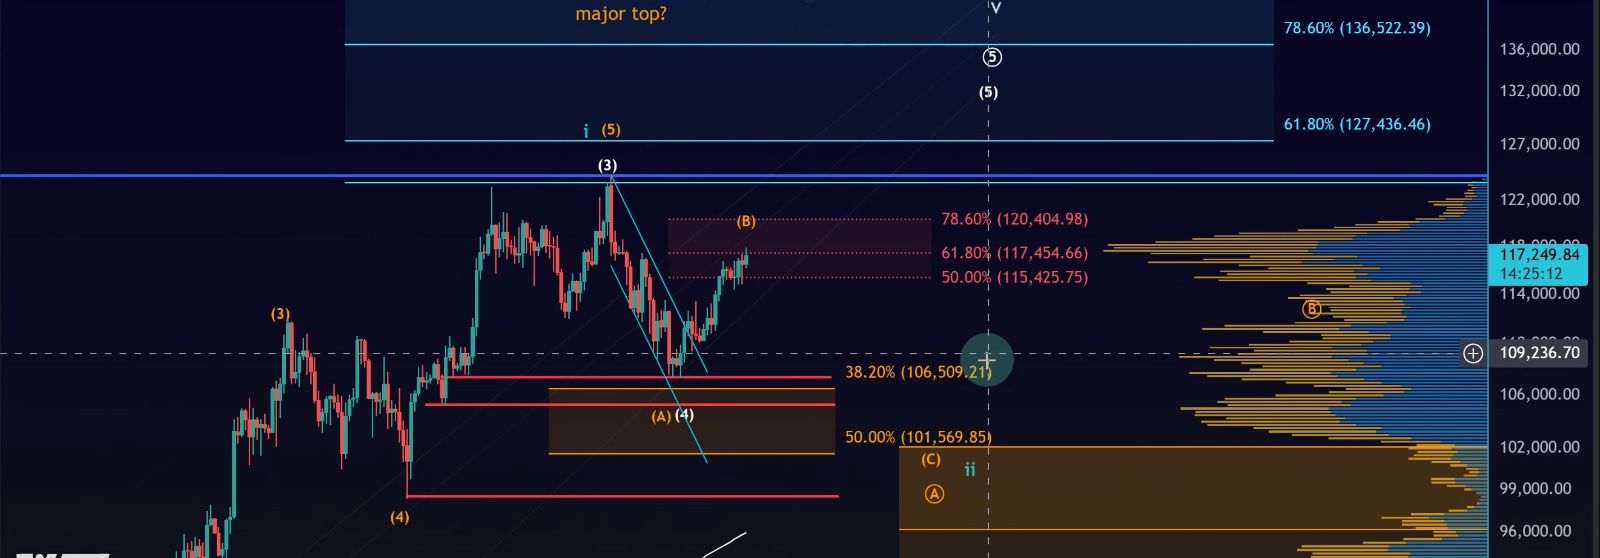
📊 Daily Chart Insights
•Volume Profile (POC at $118K): This red line has been a major target for weeks, and Bitcoin has now reached it.
•Elliott Wave Count: Our working scenarios pointed to higher prices via a B-wave rally into resistance, which has now played out.
•Key takeaway: Reaching resistance doesn’t automatically mean the trend has reversed. It’s a decision zone, not yet a confirmed top.
For now, Bitcoin is showing rejection around these levels, but until we see a clear five-wave decline breaking micro support, the trend remains up.

🤔 Why Not Bearish Yet?
Some traders questioned why we haven’t flipped bearish around the Fed meeting or at major resistance. The answer is simple:
•Elliott Wave structures take priority over headlines or speculation.
•No five-wave decline has formed yet.
•The local trend remains intact until support breaks.
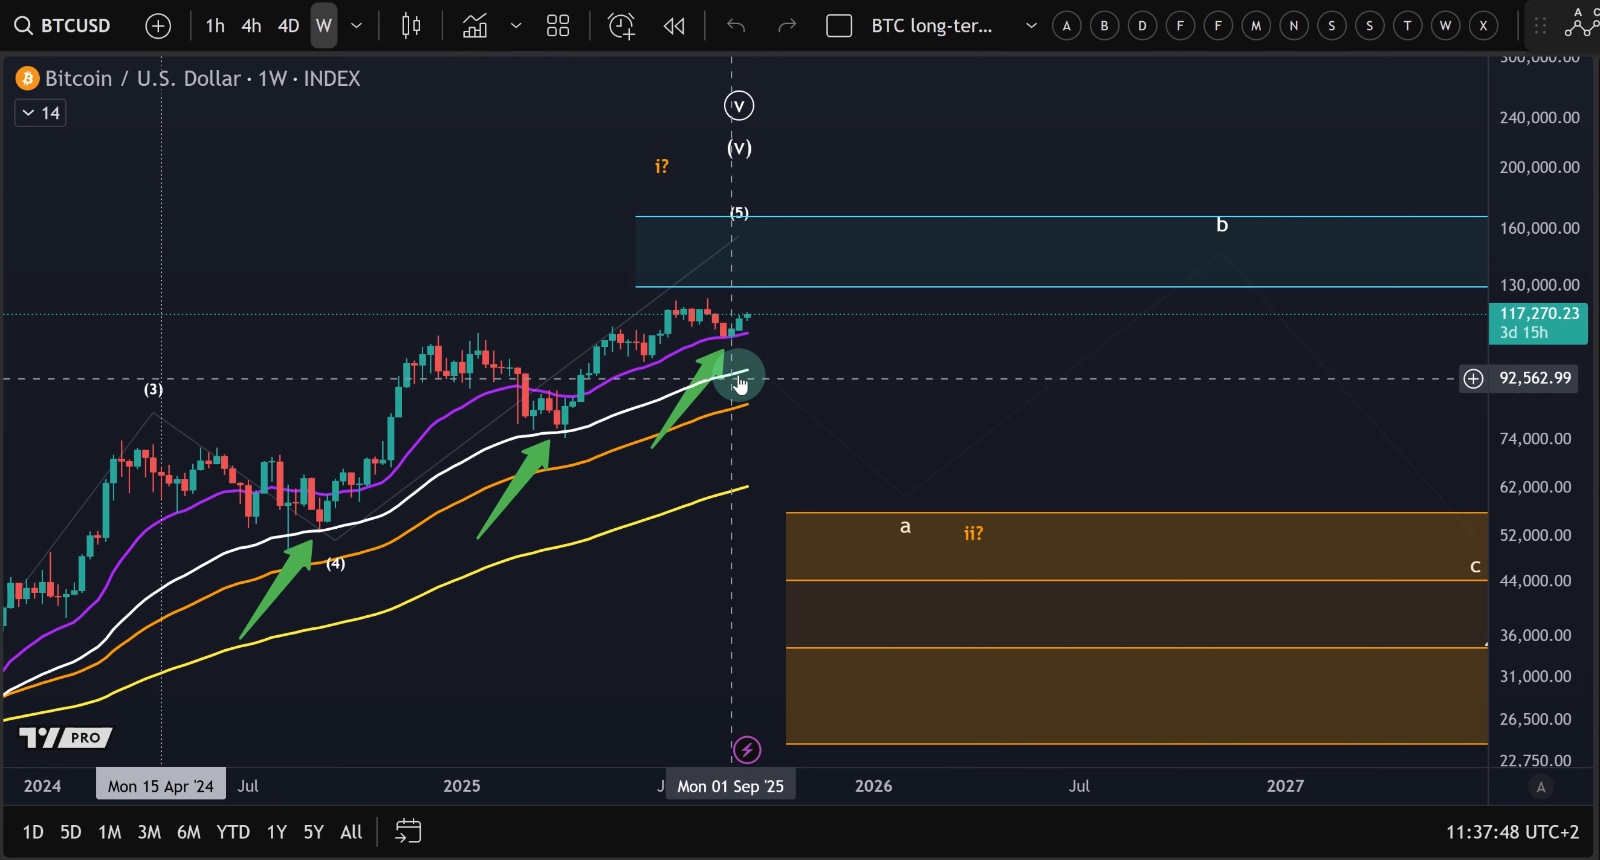
In fact, the 21-week EMA continues to hold strong support on the weekly chart. Even if we drop further, the 55-week EMA near 95K and the 200-day moving average around the 96K Fibonacci support zone would likely provide strong confluence for a bounce.
This would not necessarily be bearish – rather, a healthy correction within the broader bull trend.
📈 Short-Term Outlook
On the 30-minute chart, Bitcoin has respected the Fibonacci support zone multiple times while still tracking within its trend channel.
Key Observations:
•The market has produced several strong reactions from support, keeping the bullish structure alive.
•A move to 117K–118.5K remains likely – the “one more high” we’ve been anticipating.
•First target: 118,500, which could align with a third-wave extension in the bullish scenario.
Bearish Trigger to Watch:
•A five-wave move down breaking below yesterday’s low.
•A decisive break out of the channel to the downside.
Only then would probabilities shift in favor of a C-wave correction toward deeper support.
📌 Key Levels
•Resistance: 117,000 – 118,500 (POC + Fib retracement)
•Support (micro): Yesterday’s low, around 114,800
•Critical Support: 113,490 (must hold to avoid topping signal)
•Deeper Support Zone: 95K–96K (55-week EMA + 50% Fib)
✅ Conclusion
Bitcoin has now reached the long-watched 118K resistance zone. While rejection is visible, no confirmed top is in place. The Elliott Wave structure remains bullish until proven otherwise, and another push toward 118,500 is still on the table.
For traders, this is a decision area:
•Watch for confirmation of a five-wave decline before assuming a top.
•Respect the trend until support breaks.
•Be cautious – the higher we go, the more complete the wave pattern looks, raising the probability of a pullback.
For now, the local trend remains up, but volatility is expected as Bitcoin consolidates at this critical pivot.