
Bitcoin has not moved much since yesterday, but the chart continues to show important signals. After reacting to the Fibonacci resistance area yesterday, BTC saw a sharp rejection and move to the downside. This could mark the beginning of the C-wave decline, a scenario I discussed in detail previously.
Some traders are asking if Bitcoin is already entering a bear market. While Elliott Wave analysis suggests that a major top could be in place, broader cycle indicators and seasonality point to the bull market not being finished yet. Let’s break it down.
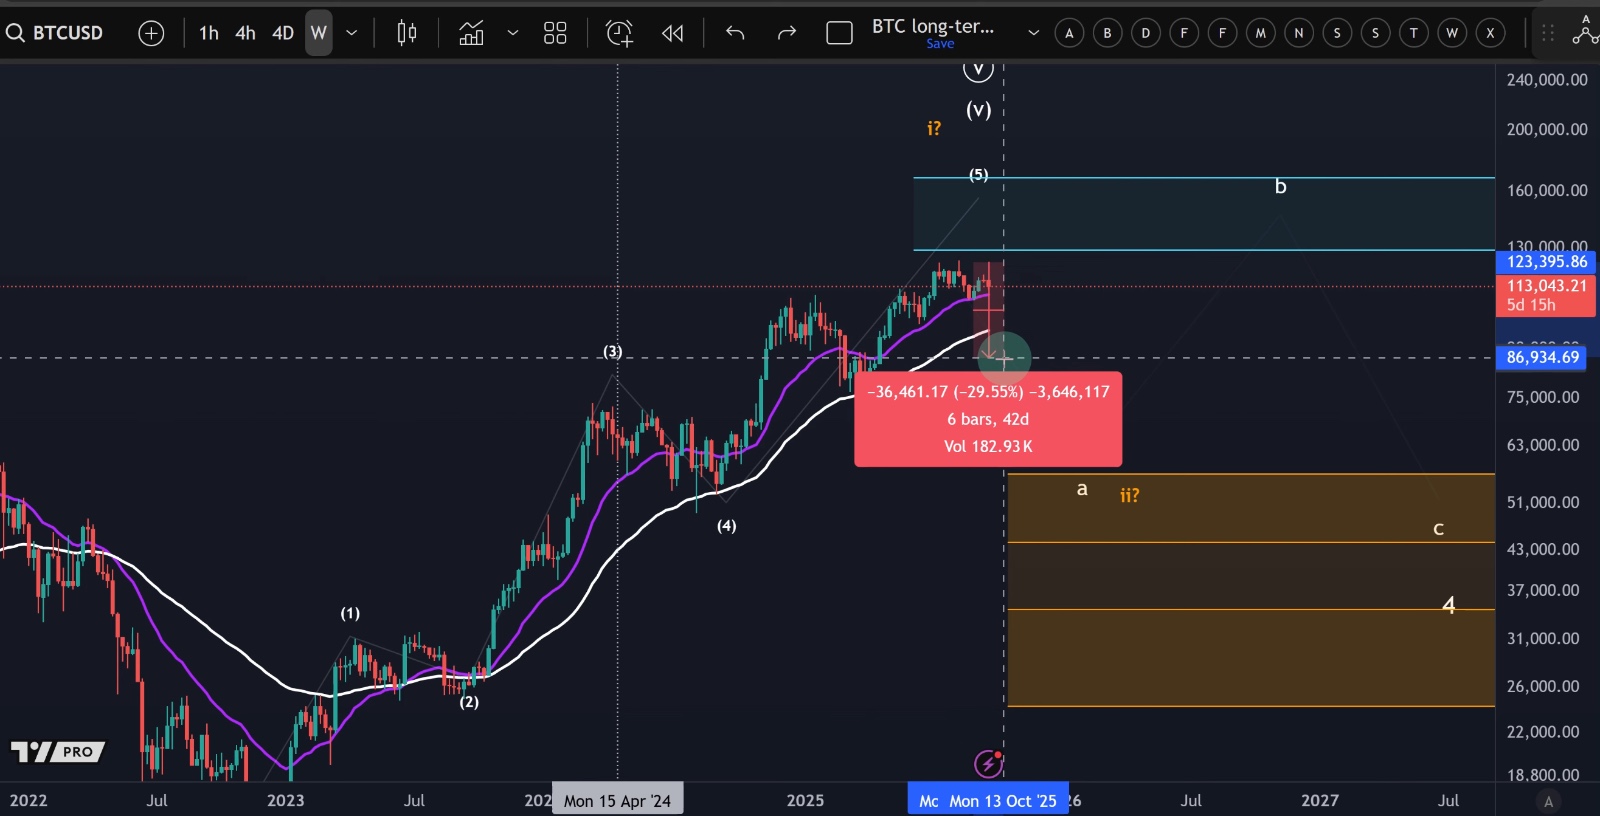
Long-Term View: Elliott Wave vs. Cycle Indicators
•From an Elliott Wave perspective, the requirements for a full five-wave rally from the 2022 low are already fulfilled.
•This means a major correction or bear market is possible, as the structural warning is there.
•However, 90% of other cycle and seasonality indicators suggest the cycle isn’t done yet.
•In fact, Q4 has historically been a strong period for Bitcoin, leaving open the possibility of another rally.
The key here: Elliott Wave gives an early warning, not confirmation. Confirmation requires price action.
The Importance of the 95K Level
One of the most critical long-term signals is the 55-week EMA, currently around $95K.
•A decisive weekly close below $95K would be a strong warning that the bull market has ended.
•Interestingly, the 1-year moving average also sits near $95K, reinforcing this level as crucial support.
•So far in 2024 and 2025, Bitcoin has respected this average, bouncing off it multiple times.
As long as BTC stays above 95K, the larger bull trend remains intact.
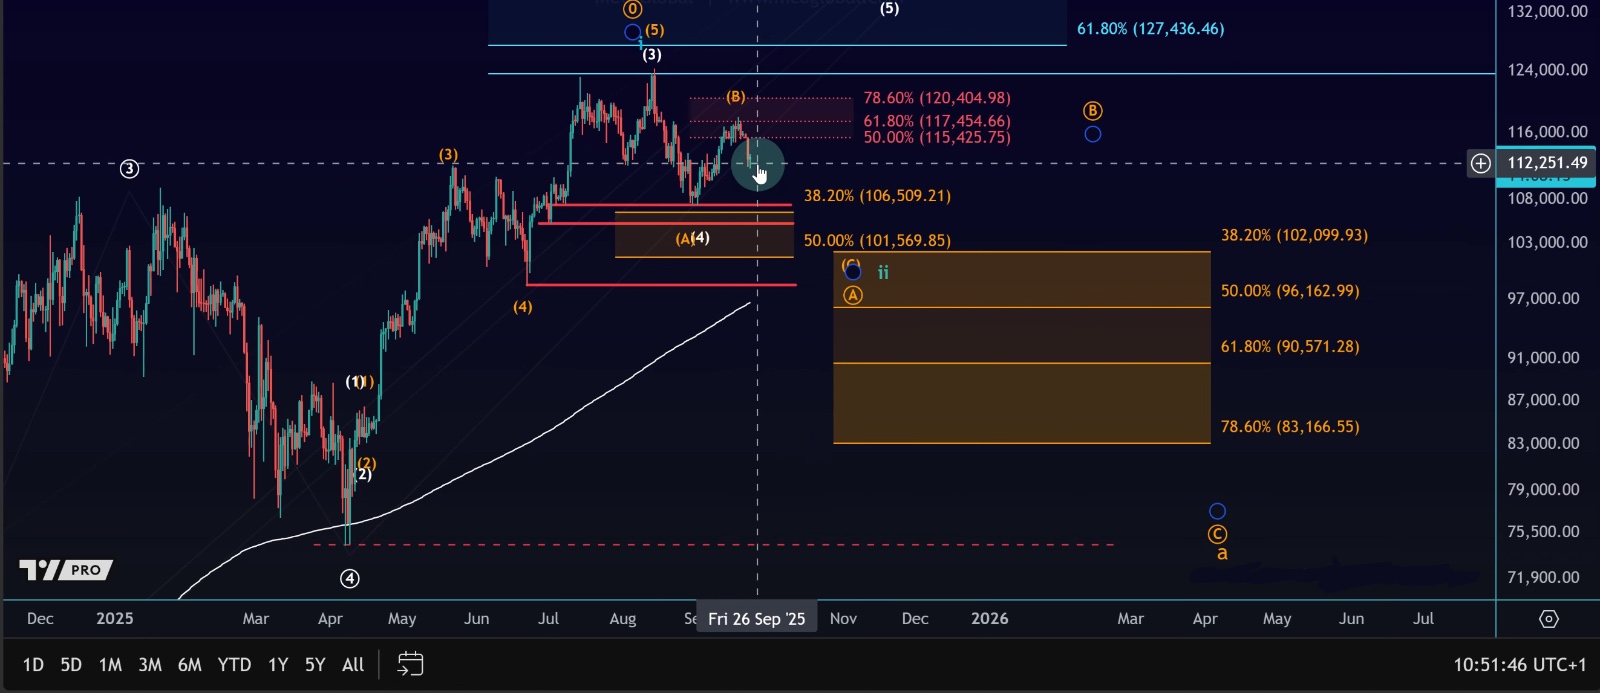
Short-Term Market Structure
On the shorter timeframe:
•BTC is still following the same corrective pattern we tracked yesterday.
•Overnight, we got one more low, but this might have only been part of a smaller 4th-wave bounce.
•For confirmation of a bearish C-wave, we need a clear five-wave move down.
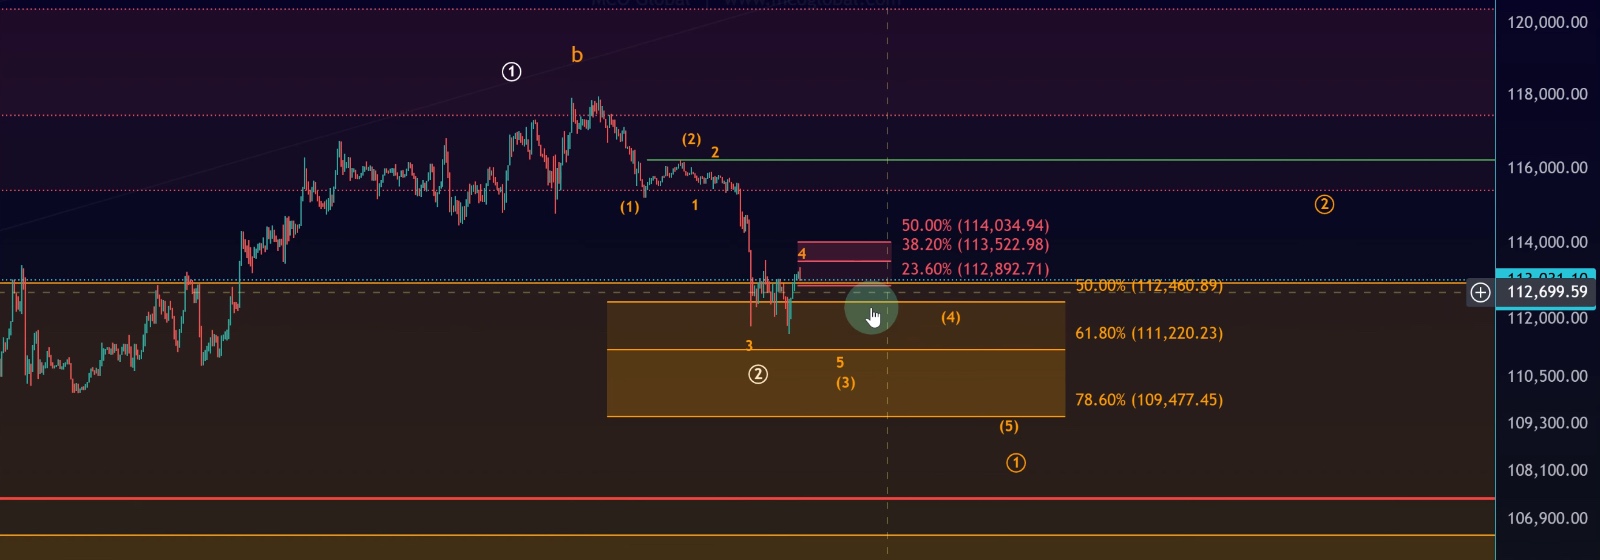
Key Levels to Watch
•Support Zones:
•$112,460 – $111,000 – $109,477
•Critical invalidation for the bullish 1–2 setup: $107,320
•Resistance Zones:
•First micro resistance just overhead
•$116,230 – a break above this level would invalidate the bearish (orange) count
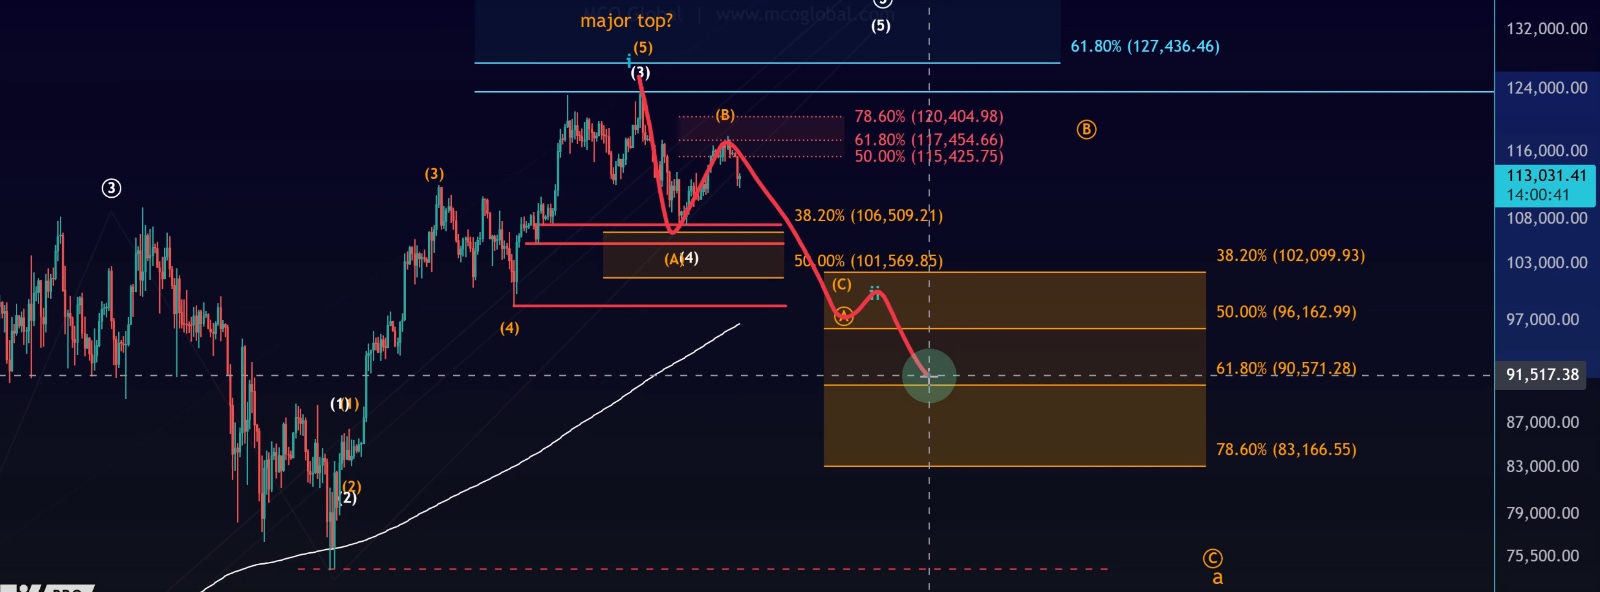
Scenarios in Play
•Orange Scenario (Bearish C-wave):
•A break below 109,477 with five waves down would confirm the B-wave top.
•After that, a corrective rally could set up a classic Elliott Wave short trade.
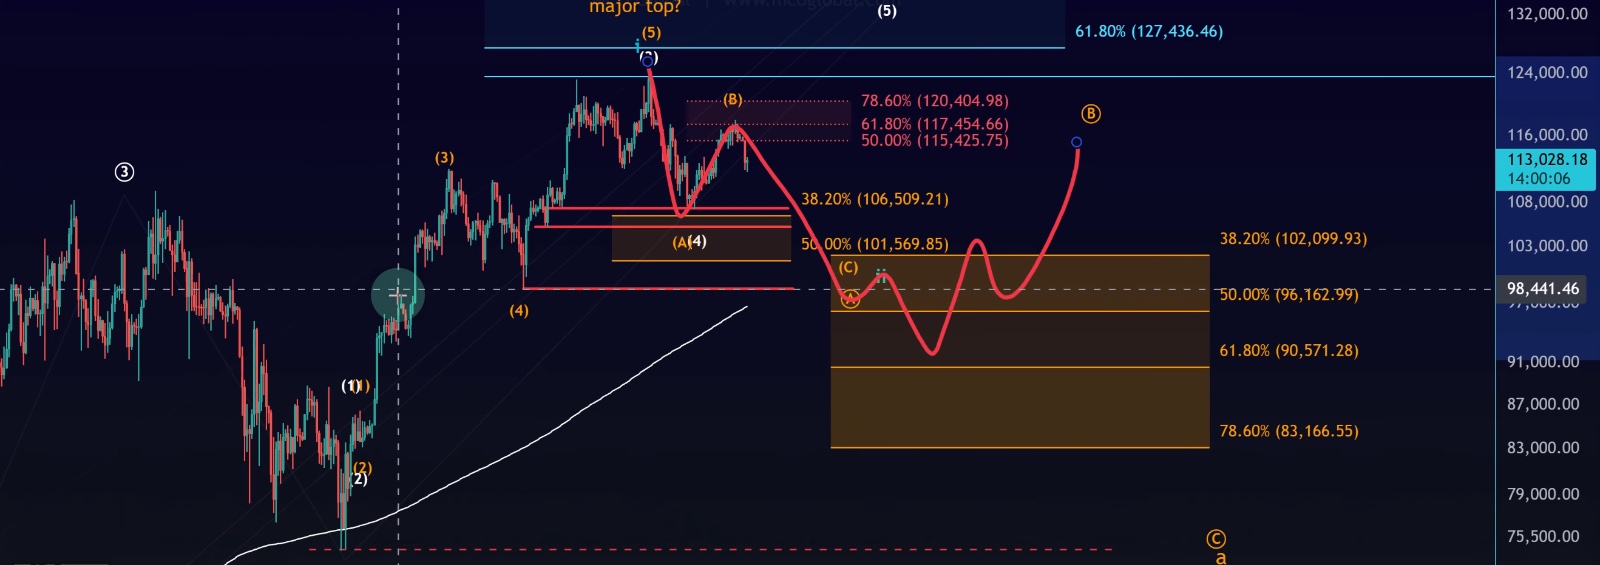
•White Scenario (Bullish rally):
•If BTC holds support and breaks above $116,230, it would point to new highs in Q4.
Final Thoughts
Right now, Bitcoin is at a crossroads:
•Elliott Wave analysis warns of a possible macro top, but broader indicators still point toward another rally.
•As long as BTC holds above $95K, the bull market remains intact.
•On the short-term chart, confirmation requires either a five-wave breakdown below 109,477 (bearish) or a break above 116,230 (bullish).
For now, the roadmap is clear: monitor support at 109K–112K, watch resistance at 116K, and remember that September weakness could still give way to a Q4 rally.