
Bitcoin continues its steady climb, moving closer to a key resistance area that traders have been watching closely for weeks. The market structure is unfolding as anticipated, and the $118K–$120K zone remains the critical area to watch in the days ahead.
📊 Daily Chart: Resistance Levels in Focus
Over the last few weeks, we highlighted the Volume Profile VRVP Point of Control around $118,000. This level, combined with the 61.8% Fibonacci retracement near $117,500 and the 78.6% retracement at $120,400, creates a powerful confluence of resistance.
In addition, multiple liquidation heat map models also align with this area, reinforcing it as a likely magnet for price.
•Current price: ~$117K
•Immediate resistance levels: $117,500 – $120,400
•Next upside targets: $117,668 and $118,500
As Bitcoin approaches this target zone, the reward-to-risk profile shifts, meaning traders should be cautious about chasing upside too aggressively. Any additional gains here should be seen as extensions of the uptrend rather than a base-case expectation.
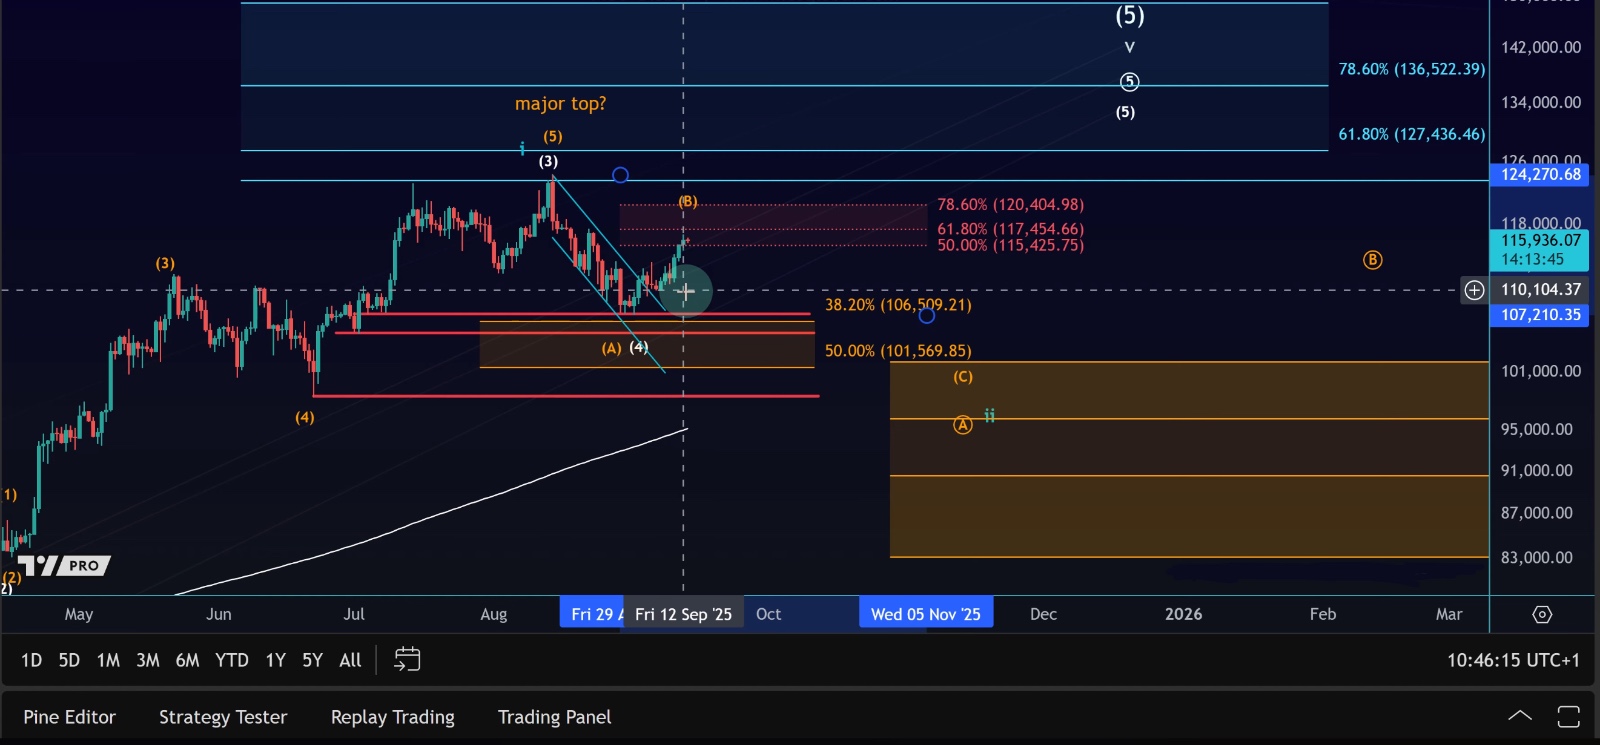
🌀 Key Scenarios: B-Wave or Wave Five?
Two main Elliott Wave scenarios remain in play:
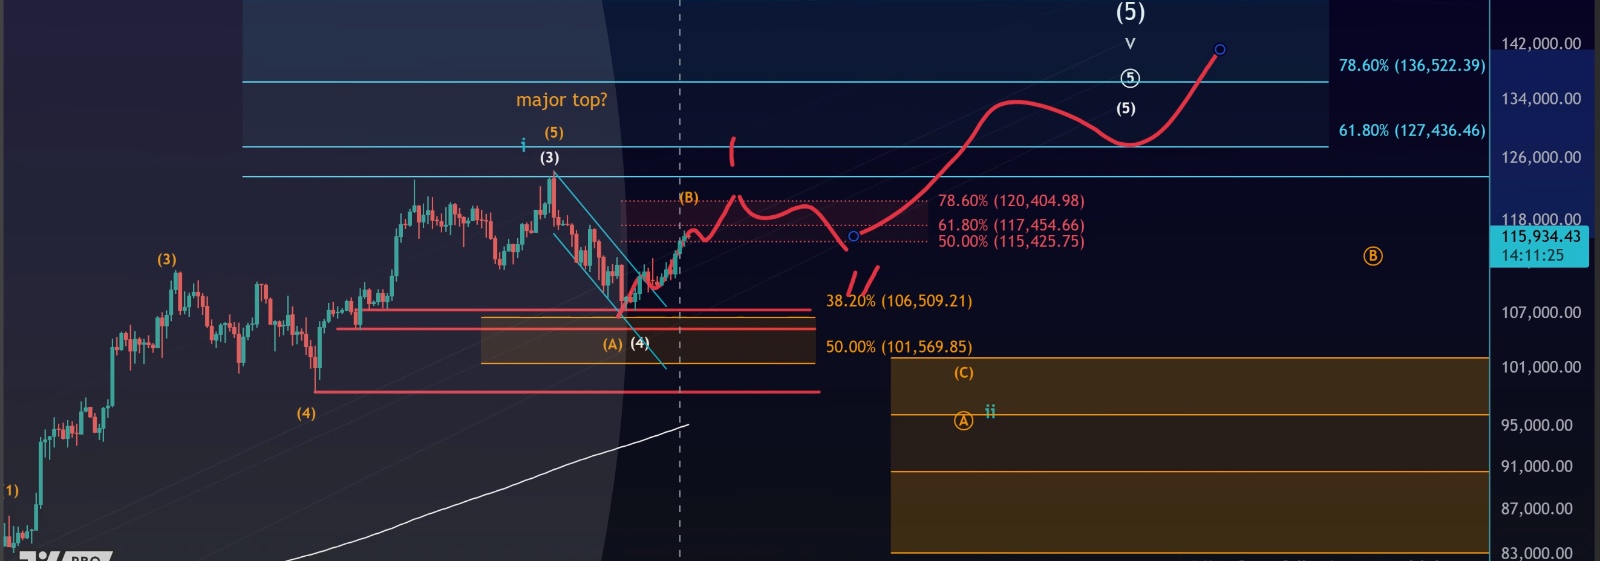
White Scenario (Wave Five)
•Bitcoin could be in a new impulsive rally.
•Structure: 5 waves up (1 → 2 → 3 → 4 → 5).
•After completion, a corrective pullback may occur, setting the stage for a larger third wave rally.
•This scenario allows for direct continuation to new all-time highs.
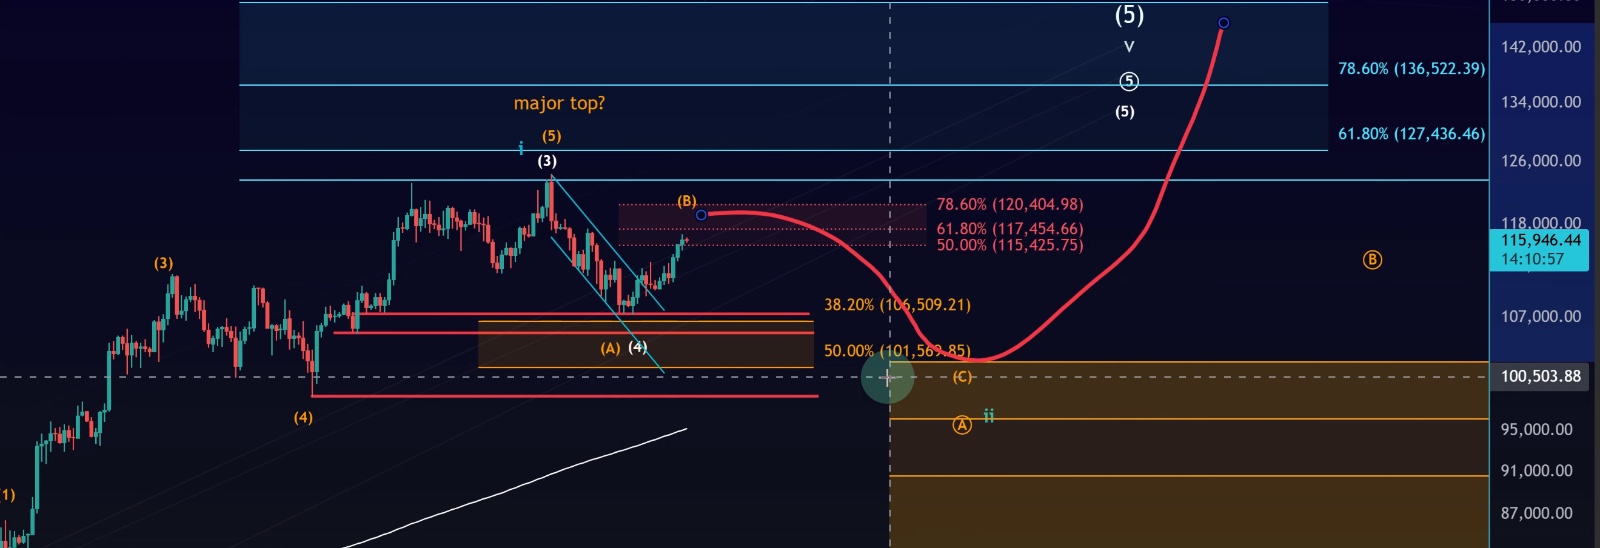
Orange Scenario (B-Wave)
•Current move represents a corrective B-wave rally.
•Bitcoin could still form a top in the $118K–$120K area before entering a C-wave correction.
•This would not be a crash but rather a healthy retracement before the next leg higher.
Both scenarios remain bullish in the bigger picture, and both keep the door open for new all-time highs.
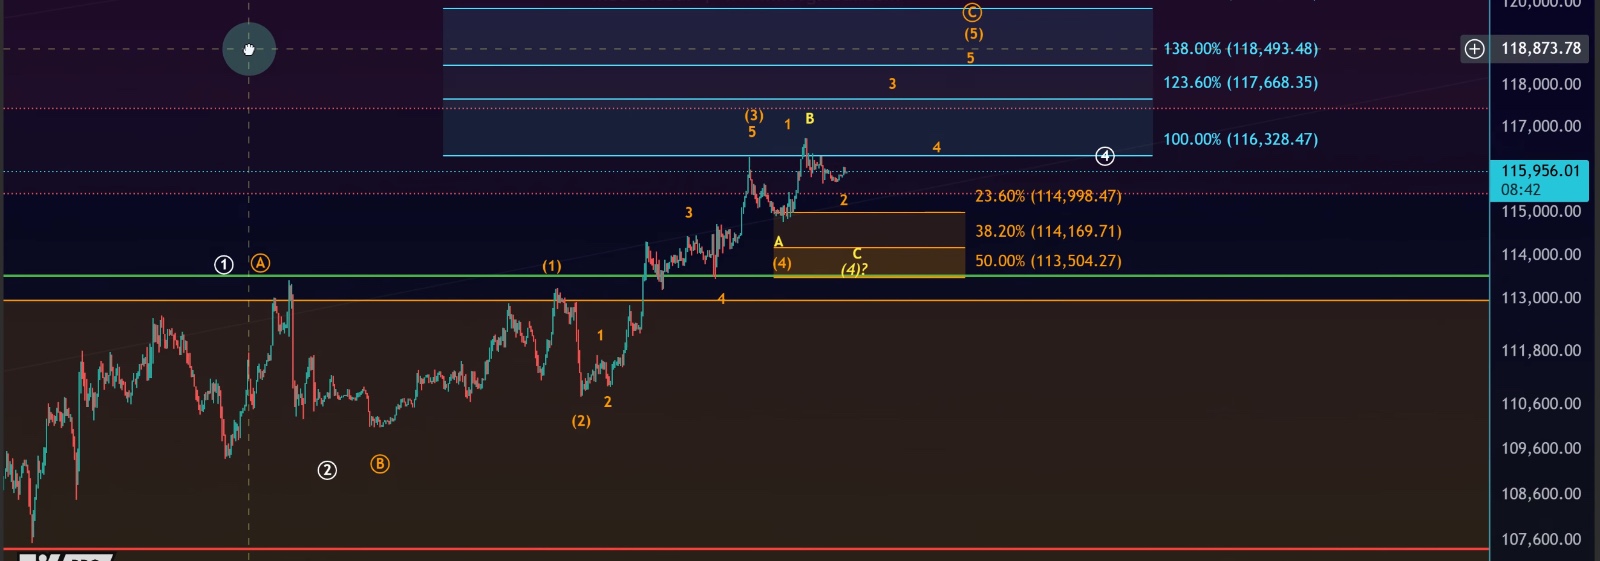
📈 Short-Term Chart: Micro Structure in Play
On the intraday chart, Bitcoin has already touched micro support levels and may now be in the fifth wave of its internal C-wave.
•Support area: $113,500 – $115,000
•Next upside targets: $117,668 → $118,500
•Extension possible: B-waves can overshoot resistance before reversing
The move up from the Friday low shows only three waves so far, which suggests this could either be:
•The first wave of a new rally, or
•A fifth wave in an ending diagonal structure.
Until we see a confirmed support break, the bias remains toward higher prices.
⚡ Key Takeaways
1.Bitcoin is approaching the $118K–$120K resistance zone, a major confluence of Fibonacci retracements, VRVP levels, and liquidation clusters.
2.Both Elliott Wave scenarios (B-wave correction or wave five impulse) remain valid.
3.Short-term upside targets are $117,668 and $118,500, with potential overshoot.
4.The closer price gets to resistance, the higher the risk of rejection.
5.Support at $113.5K–$115K remains critical — only a decisive break below it would weaken the bullish short-term outlook.
✅ Bottom line: Bitcoin is right on track toward the $118K resistance area we’ve been tracking for weeks. While higher levels are possible, traders should monitor reactions closely here. The next few sessions will help clarify whether this move is a corrective B-wave top or the early stages of a powerful wave five rally toward new highs.